by R.I. Pienaar | Mar 25, 2011 | Code
Since my last post I’ve spoken to a lot of people all excited to see something fresh in the monitoring space. I’ve learned a lot – primarily what I learned is that no one tool will please everyone. This is why monitoring systems are so hated – they try to impose their world view, they’re hard to hack on and hard to get data out. This served only to reinforce my believe that rather than build a new monitoring system I should build a framework that can build monitoring systems.
DevOps shops who can cut code, should be able to build the monitoring they want, not the monitoring their vendor thought they want.
Thus my focus has not been on how can I declare relationships between services, or how can I declare an escalation matrix. My focus has been on events and how events relate to each other.
Identifying an Event
Events can come from many places, in the recent video demo I did you saw events from Nagios and events from MCollective. I also have event bridges for my Apache Blackbox, SNMP Traps and it would be trivial to support events from GitHub commit hooks, Amazon SNS and really any conceivable source.
Events need to be identified then so that you can send information related to the same event from many sources. Your trap system might raise a trap about a port on a switch but your stats poller might emit regular packet counts – you need to know these 2 are for the same port.
You can identify events by subject and by name together they make up the event identity. Subject might be a FQDN of a host and name might be load or cpu usage.
This way if you have many ways to input information related to some event you just need to identify them correctly.
Finally as each event gets stored they get given a unique ID that you can use to pull out information about just a specific instance of an event.
Types Of Event
I have identified a couple of types of event in the first iteration:
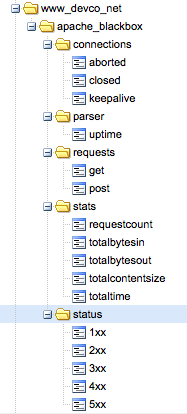
- Metric – An event like the time it took to complete a Puppet run or the amount of GET requests served by a vhost
- Status – An event associated with an up/down style state transition, can optional embed a metrics event
- Archive – An event that you just wish to archive along with others for later correlation like a callback from GitHub saying code was comitted and by whom
The event you see on the right is a metric event – it doesn’t represent one specific status and it’s a time series event which in this case got fed into Graphite.
Status events get tracked automatically – a representation is built for each unique event based on its subject and name. This status representation can progress through states like OK, Warning, Critical etc. Events sent from many different sources gets condensed and summarized into a single status representing how that status looks based on most recent received data – regardless of source of the data.
Each state transition and each non 0 severity event will raise an Alert and get routed to a – pluggable – notification framework or frameworks.
Event Associations and Metadata
Events can have a lot of additional data past what the framework needs, this is one of the advantages of NoSQL based storage. A good example of this would be a GitHub commit hook. You might want to store this and retain the rich data present in this event.
My framework lets you store all this additional data in the event archive and later on you can pick it up based on event ID and get hold of all this rich data to build reactive alerting or correction based on call backs.
Thanks to conversations with @unixdaemon I’ve now added the ability to tag events with some additional data. If you are emitting many events from many subsystems out of a certain server you might want to embed into the events the version of software currently deployed on your machine. This way you can easily identify and correlate events before and after an upgrade.
Event Routing
So this is all well and fine, I can haz data, but where am I delivering on the promise to be promiscuous with your data routing it to your own code?
- Metric data can be delivered to many metrics emitters. The Graphite one is about 50 lines of code, you can run many in parallel
- Status data is stored and state transitions result in Alert events. You can run many alert receivers that implement your own desired escalation logic
For each of these you can write routing rules that tell it what data to route to your code. You might only want data in your special metrics consumer where subject =~ /blackbox/.
I intent to sprinkle the whole thing with a rich set of callbacks where you can register code that declares an interest in metrics, alerts, status transitions etc in addition to the big consumers.
You’d use this code to correlate the amount of web requests in a metric with the ones received 7 days ago. You can then decide to raise a new status event that will alert Ops about trend changes proactively. Or maybe you want to implement your own auto-scaler where you’d provision new servers on demand.
Scaling
How does it scale? Horizontally. My tests have shown that even on a modest (virtual) hardware I am able to process and route in excess of 10 000 events a minute. If that isn’t enough you can scale out horizontally by spreading the metric, status and callback processing over multiple physical systems. Each of the metric, status and callback handlers can also scale horizontally over clusters of servers.
Bringing It All Together
So to show that this isn’t all just talk, here are 2 graphs.
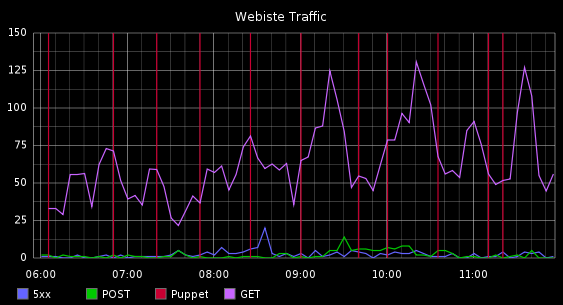
This graph shows web requests for a vhost and the times when Puppet ran.
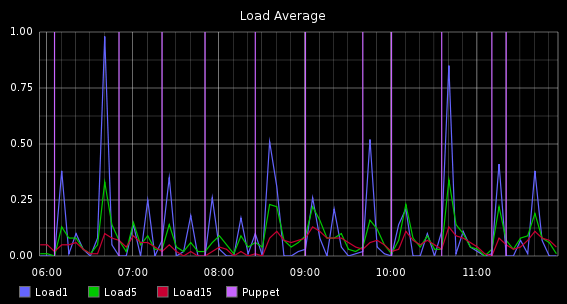
This graph shows Load Average for the server hosting the site and times when Puppet ran.
What you’re seeing here is a correlation of events from:
- Metric events from Apache Blackbox
- Status and Metric events for Load Averages from Nagios
- Metric events from Puppet pre and post commands, these are actually metrics of how long each Puppet run was but I am showing it as a vertical line
This is a seemless blend of time series data, status data and randomly occurring events like when Puppet runs, all correlated and presented in a simple manner.
by R.I. Pienaar | Aug 7, 2010 | Code
I often get asked about MCollective and other programming languages. Thus far we only support Ruby but my hope is in time we’ll be able to be more generic.
Initially I had a few requirements from serialization:
- It must retain data types
- Encoding the same data – like a hash – twice should give the same result from the point of view of md5()
That was about it really. This was while we used a pre-shared key to validate requests and so the result of the encode and decode should be the same on the sender as on the receiver. With YAML this was never the case so I used Marshal.
We recently had a SSL based security plugin contributed that relaxed the 2nd requirement so we can go back to using YAML. We could in theory relax the 1st requirement but it would just inhibit the kind of tools you can build with MCollective quite a bit. So I’d strongly suggest this is a must have.
Today there are very few cross language serializers that let you just deal with arbitrary data YAML is one that seems to have a log of language support. Prior to version 1.0.0 of MCollective the SSL security system only supported Marshal but we’ll support YAML in addition to Marshal in 1.0.0.
This enabled me to write a Perl client that speaks to your standard Ruby collective (if it runs this new plugin).
You can see the Perl client here. The Perl code is roughly a mc-find-hosts written in Perl and without command line options for filtering – though you can just adjust the filters in the code. It’s been years since I wrote any Perl so that’s just the first thing that worked for me.
Point is someone should be able to take any language that has the Syck YAML bindings and write a client library to talk with Mcollective. I tried the non Syck bindings in PHP and it’s unusable, I suspect the PHP Syck bindings will work better but I didn’t try them.
As mentioned on the user list post 1.0.0 I intend to focus on long running and scheduled requests I’ll then also work on some kind of interface between Mcollective and Agents written in other languages – since that is more or less how long running scheduled tasks would work anyway. This will then use the Ruby as a transport hooking clients and agents in different languages together.
I can see that I’ll enable this but I am very unlikely to write the clients myself. I am therefore keen to speak to community members who want to speak to MCollective from languages like Python and who have some time to work on this.
by R.I. Pienaar | Aug 5, 2010 | Code
The typical Puppet use case is to run the daemon every 30 minutes or so and just let it manage your machines. Sometimes though you want to be able to run it on all your machines as quick as your puppet master can handle.
This is tricky as you generally do not have a way to cap the concurrency and it’s hard to orchestrate that. I’ve extended the MCollective Puppet Agent to do this for you so you can do a rapid run at roll out time and then go back to the more conservative slow pace once your window is over.
The basic logic I implemented is this:
- Discover all nodes, sort them alphabetically
- Count how many nodes are active now, wait till it’s below threshold
- Run a node by just starting a –onetime background run
- Sleep a second
This should churn through your nodes very quickly without overwhelming the resources of your master. You can see it in action here, you can see it started 3 nodes and once it got to the 4th 3 were already running and it waited for one of them to finish:
% mc-puppetd -W /dev_server/ runall 2
Thu Aug 05 17:47:21 +0100 2010> Running all machines with a concurrency of 2
Thu Aug 05 17:47:21 +0100 2010> Discovering hosts to run
Thu Aug 05 17:47:23 +0100 2010> Found 4 hosts
Thu Aug 05 17:47:24 +0100 2010> Running dev1.one.net, concurrency is 0
Thu Aug 05 17:47:26 +0100 2010> dev1.one.net schedule status: OK
Thu Aug 05 17:47:28 +0100 2010> Running dev1.two.net, concurrency is 1
Thu Aug 05 17:47:30 +0100 2010> dev1.two.net schedule status: OK
Thu Aug 05 17:47:32 +0100 2010> Running dev2.two.net, concurrency is 2
Thu Aug 05 17:47:34 +0100 2010> dev2.two.net schedule status: OK
Thu Aug 05 17:47:35 +0100 2010> Currently 3 nodes running, waiting
Thu Aug 05 17:48:00 +0100 2010> Running dev3.two.net, concurrency is 2
Thu Aug 05 17:48:05 +0100 2010> dev3.two.net schedule status: OK |
% mc-puppetd -W /dev_server/ runall 2
Thu Aug 05 17:47:21 +0100 2010> Running all machines with a concurrency of 2
Thu Aug 05 17:47:21 +0100 2010> Discovering hosts to run
Thu Aug 05 17:47:23 +0100 2010> Found 4 hosts
Thu Aug 05 17:47:24 +0100 2010> Running dev1.one.net, concurrency is 0
Thu Aug 05 17:47:26 +0100 2010> dev1.one.net schedule status: OK
Thu Aug 05 17:47:28 +0100 2010> Running dev1.two.net, concurrency is 1
Thu Aug 05 17:47:30 +0100 2010> dev1.two.net schedule status: OK
Thu Aug 05 17:47:32 +0100 2010> Running dev2.two.net, concurrency is 2
Thu Aug 05 17:47:34 +0100 2010> dev2.two.net schedule status: OK
Thu Aug 05 17:47:35 +0100 2010> Currently 3 nodes running, waiting
Thu Aug 05 17:48:00 +0100 2010> Running dev3.two.net, concurrency is 2
Thu Aug 05 17:48:05 +0100 2010> dev3.two.net schedule status: OK
This is integrated into the existing mc-puppetd client script you don’t need to roll out anything new to your servers just the client side.
Using this to run each of 47 machines with a concurrency of just 4 I was able to complete a cycle in 8 minutes. Doesn’t sound too impressive but my average run time is around 40 seconds on every node with some being 90 to 150 seconds. My puppetmaster server that usually sits at a steady 0.2mbit out were serving a constant 2mbit/sec for the duration of this run.
by R.I. Pienaar | Jul 25, 2010 | Code
I have a number of ActiveMQ servers, 7 in total, 3 in a network of brokers the rest standalone. For MCollective I use topics extensively so don’t really need to monitoring them much other than for availability. I also though do a lot of Queued work where lots of machines put data in a queue and others process the data.
In the Queue scenario you absolutely need to monitor queue sizes, memory usage and such. You also need to graph things like rates of messages, consumer counts and memory use. I am busy writing a number of Nagios and Cacti plugins to help with this, you can find them on Github.
To use these you need to have the ActiveMQ Statistics Plugin enabled.
First we need to monitor queue sizes:
$ check_activemq_queue.rb --host localhost --user nagios --password passw0rd --queue exim.stats --queue-warn 1000 --queue-crit 2000
OK: ActiveMQ exim.stats has 1 messages |
$ check_activemq_queue.rb --host localhost --user nagios --password passw0rd --queue exim.stats --queue-warn 1000 --queue-crit 2000
OK: ActiveMQ exim.stats has 1 messages
This will connect to localhost monitoring a queue exim.stats warning you when it’s got 1000 messages and critical at 2000.
I need to add to this the ability to monitor memory usage, this will come over the next few days.
I also have a plugin for Cacti it can output stats for the broker as a whole and also for a specific queue. First the whole broker:
$ activemq-cacti-plugin.rb --host localhost --user nagios --password passw0rd --report broker
stomp+ssl:stomp+ssl storePercentUsage:81 size:5597 ssl:ssl vm:vm://web3 dataDirectory:/var/log/activemq/activemq-data dispatchCount:169533 brokerName:web3 openwire:tcp://web3:6166 storeUsage:869933776 memoryUsage:1564 tempUsage:0 averageEnqueueTime:1623.90502285799 enqueueCount:174080 minEnqueueTime:0.0 producerCount:0 memoryPercentUsage:0 tempLimit:104857600 messagesCached:0 consumerCount:2 memoryLimit:20971520 storeLimit:1073741824 inflightCount:9 dequeueCount:169525 brokerId:ID:web3-44651-1280002111036-0:0 tempPercentUsage:0 stomp:stomp://web3:6163 maxEnqueueTime:328585.0 expiredCount:0 |
$ activemq-cacti-plugin.rb --host localhost --user nagios --password passw0rd --report broker
stomp+ssl:stomp+ssl storePercentUsage:81 size:5597 ssl:ssl vm:vm://web3 dataDirectory:/var/log/activemq/activemq-data dispatchCount:169533 brokerName:web3 openwire:tcp://web3:6166 storeUsage:869933776 memoryUsage:1564 tempUsage:0 averageEnqueueTime:1623.90502285799 enqueueCount:174080 minEnqueueTime:0.0 producerCount:0 memoryPercentUsage:0 tempLimit:104857600 messagesCached:0 consumerCount:2 memoryLimit:20971520 storeLimit:1073741824 inflightCount:9 dequeueCount:169525 brokerId:ID:web3-44651-1280002111036-0:0 tempPercentUsage:0 stomp:stomp://web3:6163 maxEnqueueTime:328585.0 expiredCount:0
Now a specific queue:
$ activemq-cacti-plugin.rb --host localhost --user nagios --password passw0rd --report exim.stats
size:0 dispatchCount:168951 memoryUsage:0 averageEnqueueTime:1629.42897052992 enqueueCount:168951 minEnqueueTime:0.0 consumerCount:1 producerCount:0 memoryPercentUsage:0 destinationName:queue://exim.stats messagesCached:0 memoryLimit:20971520 inflightCount:0 dequeueCount:168951 expiredCount:0 maxEnqueueTime:328585.0 |
$ activemq-cacti-plugin.rb --host localhost --user nagios --password passw0rd --report exim.stats
size:0 dispatchCount:168951 memoryUsage:0 averageEnqueueTime:1629.42897052992 enqueueCount:168951 minEnqueueTime:0.0 consumerCount:1 producerCount:0 memoryPercentUsage:0 destinationName:queue://exim.stats messagesCached:0 memoryLimit:20971520 inflightCount:0 dequeueCount:168951 expiredCount:0 maxEnqueueTime:328585.0
Grab the code on GitHub and follow there, I expect a few updates in the next few weeks.
by R.I. Pienaar | Jul 14, 2010 | Code
The problem of getting EC2 images to do what you want is quite significant, mostly I find the whole thing a bit flakey and with too many moving parts.
- When and what AMI to start
- Once started how to do you configure it from base to functional. Especially in a way that doesn’t become a vendor lock.
- How do you manage the massive sprawl of instances, inventory them and track your assets
- Monitoring and general life cycle management
- When and how do you shut them, and what cleanup is needed. Being billed by the hour means this has to be a consideration
These are significant problems and just a tip of the ice berg. All of the traditional aspects of infrastructure management – like Asset Management, Monitoring, Procurement – are totally useless in the face of the cloud.
A lot of work is being done in this space by tools like Pool Party, Fog, Opscode and many other players like the countless companies launching control panels, clouds overlaying other clouds and so forth. As a keen believer in Open Source many of these options are not appealing.
I want to focus on the 2nd step above here today and show how I pulled together a number of my Open Source projects to automate that. I built a generic provisioner that hopefully is expandable and usable in your own environments. The provisioner deals with all the interactions between Puppet on nodes, the Puppet Master, the Puppet CA and the administrators.
<rant> Sadly the activity in the Puppet space is a bit lacking in the area of making it really easy to get going on a cloud. There are suggestions on the level of monitoring syslog files from a cronjob and signing certificates based on that. Really. It’s a pretty sad state of affairs when that’s the state of the art.
Compare the ease of using Chef’s Knife with a lot of the suggestions currently out there for using Puppet in EC2 like these: 1, 2, 3 and 4.
Not trying to have a general Puppet Bashing session here but I think it’s quite defining of the 2 user bases that Cloud readiness is such an after thought so far in Puppet and its community. </rant>
My basic needs are that instances all start in the same state, I just want 1 base AMI that I massage into the desired final state. Most of this work has to be done by Puppet so it’s repeatable. Driving this process will be done by MCollective.
I bootstrap the EC2 instances using my EC2 Bootstrap Helper and I use that to install MCollective with just a provision agent. It configures it and hook it into my collective.
From there I have the following steps that need to be done:
- Pick a nearby Puppet Master, perhaps using EC2 Region or country as guides
- Set up the host – perhaps using /etc/hosts – to talk to the right master
- Revoke and clean any old certs for this hostname on all masters
- Instruct the node to create a new CSR and send it to its master
- Sign the certificate
- Run my initial bootstrap Puppet environment, this sets up some hard to do things like facts my full build needs
- Run the final Puppet run in my normal production environment.
- Notify me using XMPP, Twitter, Google Calendar, Email, Boxcar and whatever else I want of the new node
This is a lot of work to be done on every node. And more importantly it’s a task that involves many other nodes like puppet masters, notifiers and so forth. It has to adapt dynamically to your environment and not need reconfiguring when you get new Puppet Masters. It has to deal with new data centers, regions and countries without needing any configuration or even a restart. It has to happen automatically without any user interaction so that your auto scaling infrastructure can take care of booting new instances even while you sleep.
The provisioning system I wrote does just this. It follows the above logic for any new node and is configurable for which facts to use to pick a master and how to notify you of new systems. It adapts automatically to your ever changing environments thanks to discovery of resources. The actions to perform on the node are easily pluggable by just creating an agent that complies to the published DDL like the sample agent.
You can see it in action in the video below. I am using Amazon’s console to start the instance, you’d absolutely want to automate that for your needs. You can also see it direct on blip.tv here. For best effect – and to be able to read the text – please fullscreen.
In case the text is unreadable in the video a log file similar to the one in the video can be seen here and an example config here
Past this point my Puppet runs are managed by my MCollective Puppet Scheduler.
While this is all done using EC2 nothing prevents you from applying these same techniques to your own data center or non cloud environment.
Hopefully this shows that you can wrap all the logic needed to do very complex interactions with systems that are perhaps not known for their good reusable API’s in simple to understand wrappers with MCollective, exposing those systems to the network at large with APIs that can be used to reach your goals.
The various bits of open source I used here are:
by R.I. Pienaar | Jul 7, 2010 | Code
Some time ago I wrote how to reuse Puppet providers in your Ruby script, I’ll take that a bit further here and show you to create any kind of resource.
Puppet works based on resources and catalogs. A catalog is a collection of resources and it will apply the catalog to a machine. So in order to do something you can do as before and call the type’s methods directly but if you wanted to build up a resource and say ‘just do it’ then you need to go via a catalog.
Here’s some code, I don’t know if this is the best way to do it, I dug around the code for ralsh to figure this out:
params = { :name => "rip",
           :comment => "R.I.Pienaar",
           :password => '......' }

pup = Puppet::Type.type(:user).new(params)

catalog = Puppet::Resource::Catalog.new
catalog.add_resource pup
catalog.apply |
params = { :name => "rip",
:comment => "R.I.Pienaar",
:password => '......' }
pup = Puppet::Type.type(:user).new(params)
catalog = Puppet::Resource::Catalog.new
catalog.add_resource pup
catalog.apply
That’s really simple and doesn’t require you to know much about the inner workings of a type, you’re just mapping the normal Puppet manifest to code and applying it. Nifty.
The natural progression – to me anyway – is to put this stuff into a MCollective agent and build a distributed ralsh.
Here’s a sample use case, I wanted to change my users password everywhere:
$ mc-rpc puppetral do type=user name=rip password='$1$xxx' |
$ mc-rpc puppetral do type=user name=rip password='$1$xxx'
And that will go out, find all my machines and use the Puppet RAL to change my password for me. You can do anything puppet can, manage /etc/hosts, add users, remove users, packages, services and anything even your own custom types can be used. Distributed and in parallel over any number of hosts.
Some other examples:
Add a user:
$ mc-rpc puppetral do type=user name=foo comment="Foo User" managehome=true |
$ mc-rpc puppetral do type=user name=foo comment="Foo User" managehome=true
Run a command using exec, with the magical creates option:
$ mc-rpc puppetral do type=exec name="/bin/date > /tmp/date" user=root timeout=5 creates="/tmp/date" |
$ mc-rpc puppetral do type=exec name="/bin/date > /tmp/date" user=root timeout=5 creates="/tmp/date"
Add an aliases entry:
$ mc-rpc puppetral do type=mailalias name=foo recipient="rip@devco.net" target="/etc/aliases" |
$ mc-rpc puppetral do type=mailalias name=foo recipient="rip@devco.net" target="/etc/aliases"
Install a package:
$ mc-rpc puppetral do type=package name=unix2dos ensure=present |
$ mc-rpc puppetral do type=package name=unix2dos ensure=present
