Since my last post I’ve spoken to a lot of people all excited to see something fresh in the monitoring space. I’ve learned a lot – primarily what I learned is that no one tool will please everyone. This is why monitoring systems are so hated – they try to impose their world view, they’re hard to hack on and hard to get data out. This served only to reinforce my believe that rather than build a new monitoring system I should build a framework that can build monitoring systems.
DevOps shops who can cut code, should be able to build the monitoring they want, not the monitoring their vendor thought they want.
Thus my focus has not been on how can I declare relationships between services, or how can I declare an escalation matrix. My focus has been on events and how events relate to each other.
Identifying an Event
Events can come from many places, in the recent video demo I did you saw events from Nagios and events from MCollective. I also have event bridges for my Apache Blackbox, SNMP Traps and it would be trivial to support events from GitHub commit hooks, Amazon SNS and really any conceivable source.
Events need to be identified then so that you can send information related to the same event from many sources. Your trap system might raise a trap about a port on a switch but your stats poller might emit regular packet counts – you need to know these 2 are for the same port.
You can identify events by subject and by name together they make up the event identity. Subject might be a FQDN of a host and name might be load or cpu usage.
This way if you have many ways to input information related to some event you just need to identify them correctly.
Finally as each event gets stored they get given a unique ID that you can use to pull out information about just a specific instance of an event.
Types Of Event
I have identified a couple of types of event in the first iteration:
- Metric – An event like the time it took to complete a Puppet run or the amount of GET requests served by a vhost
- Status – An event associated with an up/down style state transition, can optional embed a metrics event
- Archive – An event that you just wish to archive along with others for later correlation like a callback from GitHub saying code was comitted and by whom
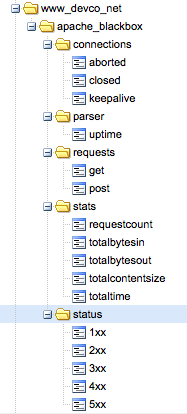
The event you see on the right is a metric event – it doesn’t represent one specific status and it’s a time series event which in this case got fed into Graphite.
Status events get tracked automatically – a representation is built for each unique event based on its subject and name. This status representation can progress through states like OK, Warning, Critical etc. Events sent from many different sources gets condensed and summarized into a single status representing how that status looks based on most recent received data – regardless of source of the data.
Each state transition and each non 0 severity event will raise an Alert and get routed to a – pluggable – notification framework or frameworks.
Event Associations and Metadata
Events can have a lot of additional data past what the framework needs, this is one of the advantages of NoSQL based storage. A good example of this would be a GitHub commit hook. You might want to store this and retain the rich data present in this event.
My framework lets you store all this additional data in the event archive and later on you can pick it up based on event ID and get hold of all this rich data to build reactive alerting or correction based on call backs.
Thanks to conversations with @unixdaemon I’ve now added the ability to tag events with some additional data. If you are emitting many events from many subsystems out of a certain server you might want to embed into the events the version of software currently deployed on your machine. This way you can easily identify and correlate events before and after an upgrade.
Event Routing
So this is all well and fine, I can haz data, but where am I delivering on the promise to be promiscuous with your data routing it to your own code?
- Metric data can be delivered to many metrics emitters. The Graphite one is about 50 lines of code, you can run many in parallel
- Status data is stored and state transitions result in Alert events. You can run many alert receivers that implement your own desired escalation logic
For each of these you can write routing rules that tell it what data to route to your code. You might only want data in your special metrics consumer where subject =~ /blackbox/.
I intent to sprinkle the whole thing with a rich set of callbacks where you can register code that declares an interest in metrics, alerts, status transitions etc in addition to the big consumers.
You’d use this code to correlate the amount of web requests in a metric with the ones received 7 days ago. You can then decide to raise a new status event that will alert Ops about trend changes proactively. Or maybe you want to implement your own auto-scaler where you’d provision new servers on demand.
Scaling
How does it scale? Horizontally. My tests have shown that even on a modest (virtual) hardware I am able to process and route in excess of 10 000 events a minute. If that isn’t enough you can scale out horizontally by spreading the metric, status and callback processing over multiple physical systems. Each of the metric, status and callback handlers can also scale horizontally over clusters of servers.
Bringing It All Together
So to show that this isn’t all just talk, here are 2 graphs.
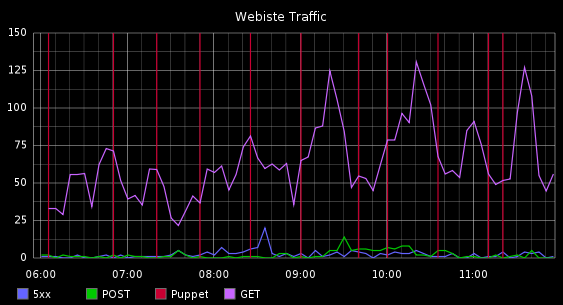
This graph shows web requests for a vhost and the times when Puppet ran.
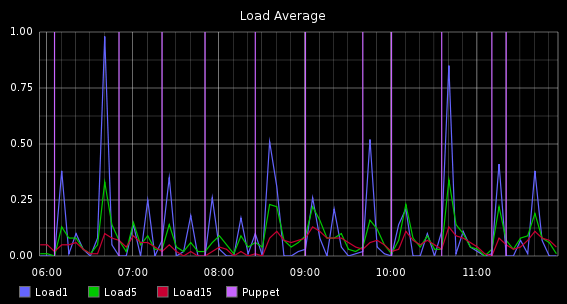
This graph shows Load Average for the server hosting the site and times when Puppet ran.
What you’re seeing here is a correlation of events from:
- Metric events from Apache Blackbox
- Status and Metric events for Load Averages from Nagios
- Metric events from Puppet pre and post commands, these are actually metrics of how long each Puppet run was but I am showing it as a vertical line
This is a seemless blend of time series data, status data and randomly occurring events like when Puppet runs, all correlated and presented in a simple manner.
