by R.I. Pienaar | Dec 11, 2011 | Code
Yesterday I gave a quick intro to the basics of Message Orientated Middleware, today we’ll build something kewl and useful.
Graphite is a fantastic statistics as a service for your network package. It can store, graph, slice and dice your time series data in ways that was only imaginable in the dark days of just having RRD files. The typical way to get data into it is to just talk to its socket and send some metric. This is great mostly but have some issues:
- You have a huge network and so you might be able to overwhelm its input channel
- You have strict policies about network connections and are not allowed to have all servers open a connection to it directly
- Your network is spread over the globe and sometimes the connections are just not reliable, but you do not wish to loose metrics during this time
Graphite solves this already by having a AMQP input channel but for the sake of seeing how we might solve these problems I’ll show how to build your own Stomp based system to do this.

We will allow all our machines to Produce messages into the Queue and we will have a small pool of Consumers that read the queue and speak to Graphite using the normal TCP protocol. We’d run Graphite and the Consumers on the same machine to give best possible availability to the TCP connections but the Middleware can be anywhere. The TCP connections to Graphite will be persistent and be reused to publish many metrics – a connection pool in other words.
Producer
So first the Producer side of things, this is a simple CLI tool that take a metric and value on the CLI and publish it.
#!/usr/bin/ruby

require 'rubygems'
require 'stomp'

raise "Please provide a metric and value on the command line" unless ARGV.size == 2
raise "The metric value must be numeric" unless ARGV[1] =~ /^[\d\.]+$/

msg = "%s.%s %s %d" % [Socket.gethostname, ARGV[0], ARGV[1], Time.now.utc.to_i]

begin
  Timeout::timeout(2) do
    stomp = Stomp::Client.new("", "", "stomp.example.com", 61613)
    stomp.publish("/queue/graphite", msg)
    stomp.close
  end
rescue Timeout::Error
  STDERR.puts "Failed to send metric within the 2 second timeout"
  exit 1
end |
#!/usr/bin/ruby
require 'rubygems'
require 'stomp'
raise "Please provide a metric and value on the command line" unless ARGV.size == 2
raise "The metric value must be numeric" unless ARGV[1] =~ /^[\d\.]+$/
msg = "%s.%s %s %d" % [Socket.gethostname, ARGV[0], ARGV[1], Time.now.utc.to_i]
begin
Timeout::timeout(2) do
stomp = Stomp::Client.new("", "", "stomp.example.com", 61613)
stomp.publish("/queue/graphite", msg)
stomp.close
end
rescue Timeout::Error
STDERR.puts "Failed to send metric within the 2 second timeout"
exit 1
end
This is all there really is to sending a message to the middleware, you’d just run this like
producer.rb load1 `cat /proc/loadavg|cut -f1 -d' '` |
producer.rb load1 `cat /proc/loadavg|cut -f1 -d' '`
Which would result in a message being sent with the body
devco.net.load1 0.1 1323597139 |
devco.net.load1 0.1 1323597139
Consumer
The consumer part of this conversation is not a whole lot more complex, you can see it below:
#!/usr/bin/ruby

require 'rubygems'
require 'stomp'

def graphite
  @graphite ||= TCPSocket.open("localhost", 2003)
end

client = Stomp::Connection.new("", "", "stomp.example.com", 61613, true)

client.subscribe("/queue/graphite")

loop do
  begin
    msg = client.receive

    graphite.puts msg
  rescue
    STDERR.puts "Failed to receive from queue: #{$!}"
    sleep 1
    retry
  end
end |
#!/usr/bin/ruby
require 'rubygems'
require 'stomp'
def graphite
@graphite ||= TCPSocket.open("localhost", 2003)
end
client = Stomp::Connection.new("", "", "stomp.example.com", 61613, true)
client.subscribe("/queue/graphite")
loop do
begin
msg = client.receive
graphite.puts msg
rescue
STDERR.puts "Failed to receive from queue: #{$!}"
sleep 1
retry
end
end
This subscribes to the queue, loops forever while reading messages that then get sent to Graphite using a normal TCP socket. This should be a bit more complex to use the transaction properties I mentioned since a crash here will loose a single message.
Results
So that is really all there is to it! You’d totally want to make the receiving end a bit more robust, make it a daemon perhaps using the Daemons or Dante Gems and add some logging. You’d agree though this is extremely simple code that anyone could write and maintain.
This code has a lot of non obvious side effects though simply because we use the Middleware for communication:
- It’s completely decoupled, the Producers don’t know anything about the Consumers other than the message format.
- It’s reliable because the Consumer can die but the Producers would not even be aware or need to care about this
- It’s scalable – by simply starting more Consumers you can consume messages from the queue quicker and in a load balanced way. Contrast this with perhaps writing a single multi threaded server with all that entails.
- It’s trivial to understand how it works and the code is completely readable
- It protects my Graphite from the Thundering Herd Problem by using the middleware as a buffer and only creating a manageable pool of writers to Graphite
- It’s language agnostic, you can produce messages from Perl, Ruby, Java etc
- The network layer can be made resilient without any code changes
You wouldn’t think this 44 lines of code could have all these properties, but they do and this is why I think this style of coding is particularly well suited to Systems Administrators. We are busy people, we do not have time to implement from scratch our own connection pooling, buffers, spools and everything else you would need to try to duplicate these points from scratch. We have 20 minutes and we just want to solve our problem. Languages like Ruby and technologies like Message Orientated Middleware lets you do this.
I’d like to expand on the one aspect a bit – I mentioned that the network topology can change without the code being aware of it and that we might have restricted firewalls preventing everyone from communicating with Graphite. Our 44 lines of code solves these problems with the help of the MOM.
By using the facilities the middleware provides to create complex networks we can distribute our connectivity layer globally as below:

Here we have producers all over the world and our central consumer sitting in the EU somewhere. The queuing and storage characteristics of the middleware is present in every region. The producers in each region only need the ability to communicate with their regional Broker.
The middleware layer is reliably connected in a Mesh topology but in the event that transatlantic communications are interrupted the US broker will store the metrics till the connection problem is resolved. At that point it will forward the messages on to the EU broker and finally to the Consumer.
We can deploy brokers in a HA configuration regionally to protect against failure there. This is very well suited for multi DC deployments, deployments in the cloud where you have machines in different Regions and Availability Zones etc.
This is also an approach you could use to also allow your DMZ machines to publish metrics without needing the ability to connect directly to the Graphite service. The middleware layer is very flexible in how it’s clustered, who makes the connections etc so it’s ideal for that.
Conclusion
So in the end with just a bit of work once we’ve invested in the underlying MOM technology and deployed that we have solved a bunch of very complex problems using very simple techniques.
While this was done with reliability and scalability in mind for me possibly the bigger win is that we now have a simple network wide service for creating metrics. You can write to the queue from almost any language and you can easily allow your developers to just emit metrics from their Java code and you can emit metrics from the system side perhaps by reusing Munin.
Using code that is not a lot more complex than this I have been able to gather 10s of thousands of Munin metrics in a very short period of time into Graphite. Was able to up my collection frequency to once every minute instead of the traditional 5 minutes and was able to do that with a load average below 1 vs below 30 for Munin. This is probably more to do with Graphite being superior than anything else but the other properties outlined above makes this very appealing. Nodes push their statistics soon as they are built and I never need to edit a Munin config file anymore to tell it where my servers are.
This enabling of all parties in the organization to quickly and easily create metrics without having an operations bottleneck is a huge win and at the heart of what it means to be a DevOps Practitioner.
Part 3 has been written, please read that next.
by R.I. Pienaar | Dec 11, 2011 | Code
As most people who follow this blog know I’m quite a fan of messaging based architectures. I am also a big fan of Ruby and I like the simplicity of the Stomp Gem to create messaging applications rather than some of the more complex options like those based on Event Machine (which I am hard pressed to even consider Ruby) or the various AMQP ones.
So I wanted to do a few blog posts on basic messaging principals and patterns and how to use those with the Stomp gem in Ruby. I think Ruby is a great choice for systems development – it’s not perfect by any stretch – but it’s a great replacement for all the things systems people tend to reach to Perl for.
Message Orientated Middleware represents a new way of inter process communications, different from previous approaches that were in-process, reliant on file system sockets or even TCP or UDP sockets. While consumers and producers connect to the middleware using TCP you simply cannot really explain how messaging works in relation to TCP. It’s a new transport that brings with it its own concepts, addressing and reliability.
There are some parallels to TCP/IP wrt to reliability as per TCP and unreliability as per UDP but that’s really where it ends – Messaging based IPC is very different and best to learn the semantics. TCP is to middleware as Ethernet frames are to TCP, it’s just one of the possible ways middleware brokers can communicate and is at a much lower level and works very differently.
Why use MOM
There are many reasons but it comes down to promoting a style of applications that scales well. Mostly it does this by a few means:
- Promotes application design that breaks complex applications into simple single function building blocks that’s easy to develop, test and scale.
- Application building blocks aren’t tightly coupled, doesn’t maintain state and can scale independently of other building blocks
- The middleware layer implementation is transparent to the application – network topologies, routing, ACLs etc can change without application code change
- The brokers provide a lot of the patterns you need for scaling – load balancing, queuing, persistence, eventual consistency, etc
- Mature brokers are designed to be scalable and highly available – very complex problems that you really do not want to attempt to solve on your own
There are many other reasons but for me these are the big ticket items – especially the 2nd one.
Note of warning though while mature brokers are fast, scalable and reliably they are not some magical silver bullet. You might be able to handle 100s of thousands of messages a second on commodity hardware but it has limits and trade offs. Enable persistence or reliable messaging and that number drops drastically.
Even without enabling reliability or persistence you can easily do dumb things that overwhelm your broker – they do not scale infinitely and each broker has design trade offs. Some dedicate single threads to topics/queues that can become a bottleneck, others do not replicate queues across a cluster and so you end up with SPOFs that you might not have expected.
Message passing might appear to be instantaneous but they do not defeat the speed of light, it’s only fast relative to the network distance, network latencies and latencies in your hardware or OS kernel.
If you wish to design a complex application that relies heavily on your middleware for HA and scaling you should expect to spend as much time learning, tuning, monitoring, trending and recovering from crashes as you might with your DBMS, Web Server or any other big complex component of your system.
Types of User
There are basically 2 terms that are used to describe actors in a message orientated system. You have software that produce messages called Producers and ones consuming them called Consumers. Your application might be both a producer and a consumer but these terms are what I’ll use to describe the roles of various actors in a system.
Types of Message
In the Stomp world there really are only two types of message destinations. Message destinations have names like /topic/my.input or /queue/my.input. Here we have 2 message sources – the one is a Topic and the other is a Queue. The format of these names might even change between broker implementations.
There are some riffs on these 2 types of message source – you get short lived private destinations, queues that vanish soon as all subscribers are gone, you get topics that behave like queues and so forth. The basic principals you need to know are just Topics and Queues and detail on these can be seen below, the rest builds on these.
Topics
A topic is basically a named broadcast zone. If I produce a single message into a topic called /topic/my.input and there are 10 consumers of that topic then all 10 will get a copy of the message. Messages are not stored when you aren’t around to read them – it’s a stream of messages that you can just tap into as needed.
There might be some buffers involved which means if you’re a bit slow to consume messages you will have a few 100 or 1000 there waiting depending on your settings, but this is just a buffer it’s not really a store and shouldn’t be relied on. If your process crash the buffer is lost. If the buffer overflow messages are lost.
The use of topic is often described as having Publish and Subscribe semantics since consumers Subscribe and every subscriber will get messages that are published.

Topics are often used in cases where you do not need reliable handling of your data. A stock symbol or high frequency status message from your monitoring system might go over topics. If you miss the current stock price soon enough the next update will come that would supersede the previous one so why would you queue them, perfect use for a broadcast based system.
Queues
Instead of broadcasting messages queues will store messages if no-one is around to consume them and a queue will load balance the work load across consumers.
This style of message is often used to create async workers that does some kind of long running task.

Imagine you need to convert many documents from MS Word to PDF – maybe after someone uploaded it to your site. You would create each job request in a queue and your converter process consumes the queue. If the converter is too slow or you need more capacity you simply need to add more consumers – perhaps even on different servers – and the middleware will ensure the traffic is load shared across the consumers.
You can therefore focus on a single function process – convert document to PDF – and the horizontal scalability comes at a very small cost on the part of the code since the middleware handles most of that for you. Messages are stored in the broker reliably and if you choose can even survive broker crashes and server reboots.
Additionally queues generally have a transaction metaphor, you start a transaction when you begin to process the document and if you crash mid processing the message will be requeued for later processing. To avoid a infinite loop of a bad message that crash all Consumers the brokers will also have a Dead Letter Queue where messages that have been retried too many times will go to sit in Limbo for an administrator to investigate.
These few basic features enable you to create software that resilient to failure, scalable and not susceptible to thundering herd problems. You can easily monitor the size of queues and know if your workers are not keeping up so you can provision more worker capacity – or retire unneeded capacity.
Demonstration
Playing with these concepts is very easy, you need a middleware broker and the Stomp library for Ruby, follow the steps below to install both in a simple sandbox that you can delete when you’re done. I’ll assume you installed Ruby, Rubygems and Python with your OS package management.
Note I am using CoilMQ here instead of the Ruby Stompserver since Stompserver has some bug with queues – they just don’t work right at all.
$ export GEM_HOME=/tmp/gems
$ export PYTHONPATH=/tmp/python
$ gem install stomp
$ mkdir /tmp/python; easy_install -d /tmp/python CoilMQ
$ /tmp/python/coilmq |
$ export GEM_HOME=/tmp/gems
$ export PYTHONPATH=/tmp/python
$ gem install stomp
$ mkdir /tmp/python; easy_install -d /tmp/python CoilMQ
$ /tmp/python/coilmq
At this point you have a working Stomp server that is listening on port 61613, you can just ^C it when you are done. If you want to do the stuff below using more than one machine then add to the command line for stompserver -b 0.0.0.0 and make sure port 61613 is open on your machine. The exercises below will work fine on one machine or twenty.
To test topics we first create multiple consumers, I suggest you do this in Screen and open multiple terms, for each terminal set the GEM_HOME as above.
Start 2 or 3 of these, these are consumers on the topic:
$ STOMP_HOST=localhost STOMP_PORT=61613 /tmp/gems/bin/stompcat /topic/my.input
Connecting to stomp://localhost:61613 as
Getting output from /topic/my.input |
$ STOMP_HOST=localhost STOMP_PORT=61613 /tmp/gems/bin/stompcat /topic/my.input
Connecting to stomp://localhost:61613 as
Getting output from /topic/my.input
Now we’ll create 1 producer and send a few messages, just type into the console I typed 1, 2, 3 (ignore the warnings about deprecation):
$ STOMP_HOST=localhost STOMP_PORT=61613 /tmp/gems/bin/catstomp /topic/my.input
Connecting to stomp://localhost:61613 as
Sending input to /topic/my.input
1
2
3 |
$ STOMP_HOST=localhost STOMP_PORT=61613 /tmp/gems/bin/catstomp /topic/my.input
Connecting to stomp://localhost:61613 as
Sending input to /topic/my.input
1
2
3
You should see these messages showing up on each of your consumers at roughly the same time and all your consumers should have received each message.
Now try the same with /queue/my.input instead of the topic and you should see that the messages are distributed evenly across your consumers.
You should also try to create messages with no consumers present and then subscribe consumers to the queue or topic, you’ll notice the difference in persistence behavior between topics and queues right away
When you’re done you can ^C everything and just rm /tmp/python and /tmp/gems.
That’s it for today, I’ll post several follow up posts soon.
UPDATE: part 2 has been published.
by R.I. Pienaar | Oct 8, 2011 | Code
I love graphite, I think it’s amazing, I specifically love that it’s essentially Stats as a Service for your network since you can get hold of the raw data to integrate into other tools.
I’ve started pushing more and more things to it on my network like all my Munin data as per my previous blog post.
What’s missing though is a very simple to manage dashboard. Work is ongoing by the Graphite team on this and there’s been a new release this week that refines their own dashboard even more.
I wanted a specific kind of dashboard though:
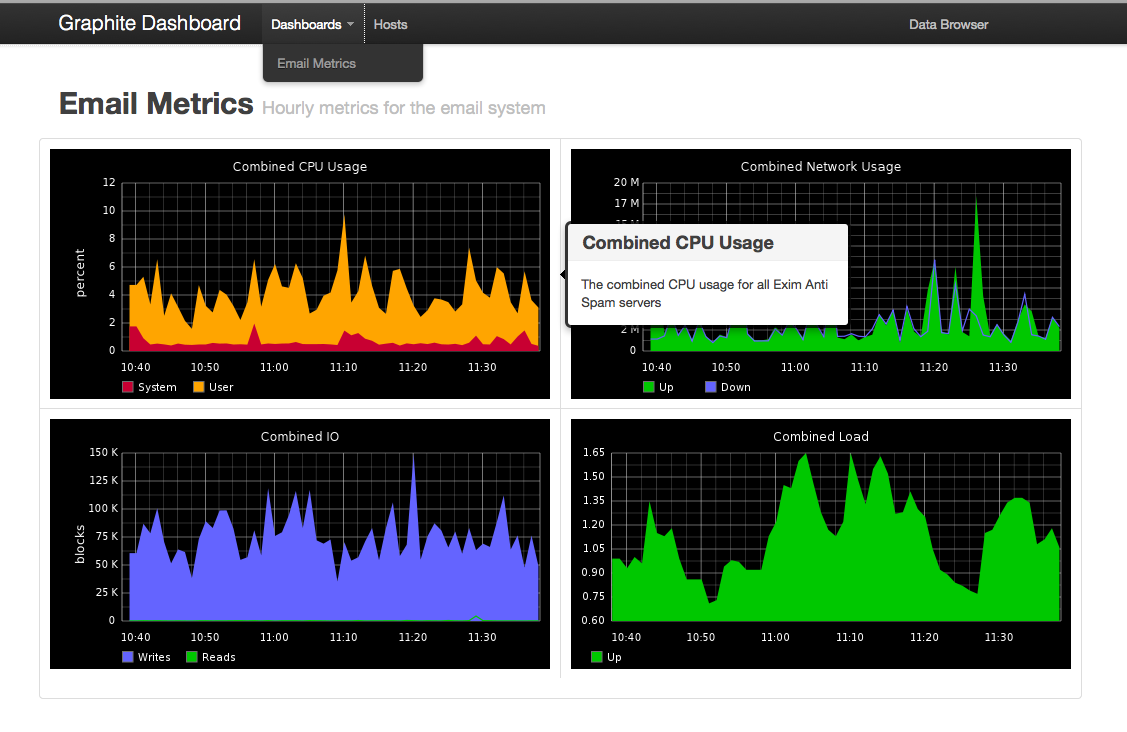
- The graph descriptions should be files that you can version control
- Graphs should have meta data that’s visible to people looking at the graphs for context. The image below show a popup that is activated by hovering over a graph.
- Easy bookmarkable URLs
- Works in common browsers and resolutions
- Allow graphs to be added/removed/edited on the fly without any heavy restarts required using something like Puppet/Chef – graphs are just text files in a directory
- Dashboards and graphs should be separate files that can be shared and reused
I wrote such a dashboard with the very boring name – GDash – that you can find in my GitHub. It only needs Sinatra and uses the excellent Twitter bootstrap framework for the visual side of things.
click for full size
The project is setup to be hosted in any Rack server like Passenger but it will also just work in Heroku, if you hosted it on Heroku it would create URLs to your private graphite install. To get it going on Heroku just follow their QuickStart Guide. Their free tier should be enough for a decent sized dashboard. Deploying the app into Heroku once you are signed up and setup locally is just 2 commands.
You should only need to edit the config.ru file to optionally enable authentication and to point it at your Graphite and give it a name. After that you can add graphs, the example one that creates the above image is in the sample directory.
More detail about the graph DSL used to describe graphs can be found at GitHub, I know the docs for the DSL needs to be improved and will do so soon.
I have a few plans for the future:
- As I am looking to replace Munin I will add a host view that will show common data per host. It will show all the data there and you can give it display hints using the same DSL
- Add a display mode suitable for big monitors – wider layout, no menu bar
- Some more configuration options for example to set defaults that apply to all graphs
- Add a way to use dygraphs to display Graphite data
Ideas, feedback and contributions welcome!
by R.I. Pienaar | Oct 2, 2011 | Code
I’ve blogged a lot about a new kind of monitoring but what I didn’t point out is that I do actually like the existing toolset.
I quite like Nagios. It’s configuration is horrible yes, the web ui is near useless, it throws away useful information like perfdata. It is though a good poller, it’s solid, never crashes, doesn’t use too much resources and have created a fairly decent plugin protocol (except for it’s perfdata representation).
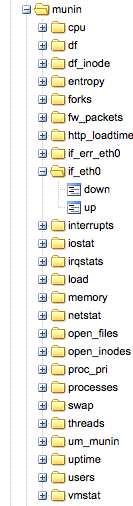 I am at two minds about munin, I like munin-node and the plugin model. I love that there are 100s of plugins available already. I love the introspection that let’s machines discover their own capabilities. But I hate everything about the central munin poller that’s supposed to be able to scale and query all your servers and pre-create graphs. It simply doesn’t work, even on a few 100 machines it’s a completely broken model.
So I am trying to find ways to keep these older tools – and their collective thousands of plugins – around but improve things to bring them into the fold of my ideas about monitoring.
For munin I want to get rid of the central poller, I’d rather have each node produce its data and push it somewhere. In my case I want to put the data into a middleware queue and process the data later into an archive or graphite or some other system like OpenTSDB. I had a look around for some Ruby / Munin integrations and came across a few, I only investigated 2.
Adam Jacob has a nice little munin 2 graphite script that simply talks straight to graphite, this might be enough for some of you so check it out. I also found munin-ruby from Dan Sosedoff which is what I ended up using.
Using the munin-ruby code is really simple:
#!/usr/bin/ruby

require 'rubygems'
require 'munin-ruby'

# connect to munin on localhost
munin = Munin::Node.new("localhost", :port => 4949)

# get each service and print it's metrics
munin.services.each do |service|
   puts "Metrics for service: #{service}"

   munin.service(service).params.each_pair do |k, v|
      puts "   #{k} => #{v}"
   end

   puts
end |
#!/usr/bin/ruby
require 'rubygems'
require 'munin-ruby'
# connect to munin on localhost
munin = Munin::Node.new("localhost", :port => 4949)
# get each service and print it's metrics
munin.services.each do |service|
puts "Metrics for service: #{service}"
munin.service(service).params.each_pair do |k, v|
puts " #{k} => #{v}"
end
puts
end
This creates output like this:
Metrics for service: entropy
   entropy => 174

Metrics for service: forks
forks => 7114853 |
Metrics for service: entropy
entropy => 174
Metrics for service: forks
forks => 7114853
So from here it’s not far to go to get these events onto my middleware, I turn them into JSON blobs like, the last one is a stat about the collector:
{"name":"munin","text":"entropy","subject":"devco.net","tags":{},"metrics":{"entropy.entropy":"162"},"origin":"munin","type":"metric","event_time":1317548538,"severity":0}
{"name":"munin","text":"forks","subject":"devco.net","tags":{},"metrics":{"forks.forks":"7115300"},"origin":"munin","type":"metric","event_time":1317548538,"severity":0}
{"name":"munin","text":"","subject":"devco.net","tags":{},"metrics":{"um_munin.time":3.722587,"um_munin.services":27,"um_munin.metrics":109,"um_munin.sleep":4},"origin":"munin","type":"metric","event_time":1317548538,"severity":0} |
{"name":"munin","text":"entropy","subject":"devco.net","tags":{},"metrics":{"entropy.entropy":"162"},"origin":"munin","type":"metric","event_time":1317548538,"severity":0}
{"name":"munin","text":"forks","subject":"devco.net","tags":{},"metrics":{"forks.forks":"7115300"},"origin":"munin","type":"metric","event_time":1317548538,"severity":0}
{"name":"munin","text":"","subject":"devco.net","tags":{},"metrics":{"um_munin.time":3.722587,"um_munin.services":27,"um_munin.metrics":109,"um_munin.sleep":4},"origin":"munin","type":"metric","event_time":1317548538,"severity":0}
The code that creates and sends this JSON can be seen here, it’s probably useful just to learn from and create your own as that’s a bit specific to me.
Of course my event system already has the infrastructure to turn these JSON events into graphite data that you can see in the image attached to this post so this was a really quick win.
The remaining question is about presentation, I want to create some kind of quick node view system like Munin has. I loved the introspection that you can do to a munin node to discover graph properties there might be something there I can use otherwise I’ll end up making a simple viewer for this.
I imagine for each branch of the munin data like cpu I can either by default just show all the data or take hints from a small DSL no how to present the data there. You’d need to know that some data needs to be derived or used as guages etc. More on that when I had some time to play.
by R.I. Pienaar | Jul 29, 2011 | Code
I’ve often wondered how things will change in a world where everything is a REST API and how relevant our Unix CLI tool chain will be in the long run. I’ve known we needed CLI ways to interact with data – like JSON data – and have given this a lot of thought.
MS Powershell does some pretty impressive object parsing on their CLI but I was never really sure how close we could get to that in Unix. I’ve wanted to start my journey with the grep utility as that seemed a natural starting point and my most used CLI tool.
I have no idea how to write parsers and matchers but luckily I have a very talented programmer working for me who were able to take my ideas and realize them awesomely. Pieter wrote a json grep and I want to show off a few bits of what it can do.
I’ll work with the document below:
[
  {"name":"R.I.Pienaar",
   "contacts": [
                 {"protocol":"twitter", "address":"ripienaar"},
                 {"protocol":"email", "address":"rip@devco.net"},
                 {"protocol":"msisdn", "address":"1234567890"}
               ]
  },
  {"name":"Pieter Loubser",
   "contacts": [
                 {"protocol":"twitter", "address":"pieterloubser"},
                 {"protocol":"email", "address":"foo@example.com"},
                 {"protocol":"msisdn", "address":"1234567890"}
               ]
  }
] |
[
{"name":"R.I.Pienaar",
"contacts": [
{"protocol":"twitter", "address":"ripienaar"},
{"protocol":"email", "address":"rip@devco.net"},
{"protocol":"msisdn", "address":"1234567890"}
]
},
{"name":"Pieter Loubser",
"contacts": [
{"protocol":"twitter", "address":"pieterloubser"},
{"protocol":"email", "address":"foo@example.com"},
{"protocol":"msisdn", "address":"1234567890"}
]
}
]
There are a few interesting things to note about this data:
- The document is an array of hashes, this maps well to the stream of data paradigm we know from lines of text in a file. This is the basic structure jgrep works on.
- Each document has another nested set of documents in an array – the contacts array.
Examples
The examples below show a few possible grep use cases:
A simple grep for a single key in the document:
$ cat example.json | jgrep "name='R.I.Pienaar'"
[
  {"name":"R.I.Pienaar",
   "contacts": [
                 {"protocol":"twitter", "address":"ripienaar"},
                 {"protocol":"email", "address":"rip@devco.net"},
                 {"protocol":"msisdn", "address":"1234567890"}
               ]
  }
] |
$ cat example.json | jgrep "name='R.I.Pienaar'"
[
{"name":"R.I.Pienaar",
"contacts": [
{"protocol":"twitter", "address":"ripienaar"},
{"protocol":"email", "address":"rip@devco.net"},
{"protocol":"msisdn", "address":"1234567890"}
]
}
]
We can extract a single key from the result:
$ cat example.json | jgrep "name='R.I.Pienaar'" -s name
R.I.Pienaar |
$ cat example.json | jgrep "name='R.I.Pienaar'" -s name
R.I.Pienaar
A simple grep for 2 keys in the document:
% cat example.json |
    jgrep "name='R.I.Pienaar' and contacts.protocol=twitter" -s name
R.I.Pienaar |
% cat example.json |
jgrep "name='R.I.Pienaar' and contacts.protocol=twitter" -s name
R.I.Pienaar
The nested document pose a problem though, if we were to search for contacts.protocol=twitter and contacts.address=1234567890 we will get both documents and not none, that’s because in order to effectively search the sub documents we need to ensure that these 2 values exist in the same sub document.
$ cat example.json |
jgrep "[contacts.protocol=twitter and contacts.address=1234567890]" |
$ cat example.json |
jgrep "[contacts.protocol=twitter and contacts.address=1234567890]"
Placing [] around the 2 terms works like () but restricts the search to the specific sub document. In this case there is no sub document in the contacts array that has both twitter and 1234567890.
Of course you can have many search terms:
% cat example.json |
     jgrep "[contacts.protocol=twitter and contacts.address=1234567890] or name='R.I.Pienaar'" -s name
R.I.Pienaar |
% cat example.json |
jgrep "[contacts.protocol=twitter and contacts.address=1234567890] or name='R.I.Pienaar'" -s name
R.I.Pienaar
We can also construct entirely new documents:
% cat example.json | jgrep "name='R.I.Pienaar'" -s "name contacts.address"
[
  {
    "name": "R.I.Pienaar",
    "contacts.address": [
      "ripienaar",
      "rip@devco.net",
      "1234567890"
    ]
  }
] |
% cat example.json | jgrep "name='R.I.Pienaar'" -s "name contacts.address"
[
{
"name": "R.I.Pienaar",
"contacts.address": [
"ripienaar",
"rip@devco.net",
"1234567890"
]
}
]
Real World
So I am adding JSON output support to MCollective, today I was rolling out a new Nagios check script to my nodes and wanted to be sure they all had it. I used the File Manager agent to fetch the stats for my file from all the machines then printed the ones that didn’t match my expected MD5.
$ mco rpc filemgr status file=/.../check_puppet.rb -j |
   jgrep 'data.md5!=a4fdf7a8cc756d0455357b37501c24b5' -s sender
box1.example.com |
$ mco rpc filemgr status file=/.../check_puppet.rb -j |
jgrep 'data.md5!=a4fdf7a8cc756d0455357b37501c24b5' -s sender
box1.example.com
Eventually you will be able to then pipe this output to mco again and call another agent, here I take all the machines that didn’t yet have the right file and cause a puppet run to happen on them, this is very Powershell like and the eventual use case I am building this for:
$ mco rpc filemgr status file=/.../check_puppet.rb -j |
   jgrep 'data.md5!=a4fdf7a8cc756d0455357b37501c24b5' |
mco rpc puppetd runonce |
$ mco rpc filemgr status file=/.../check_puppet.rb -j |
jgrep 'data.md5!=a4fdf7a8cc756d0455357b37501c24b5' |
mco rpc puppetd runonce
I also wanted to know the total size of a logfile across my web servers to be sure I would have enough space to copy them all:
$ mco rpc filemgr status file=/var/log/httpd/access_log -W /apache/ -j |
    jgrep -s "data.size"|
    awk '{ SUM += $1} END { print SUM/1024/1024 " MB"}'
2757.9093 MB |
$ mco rpc filemgr status file=/var/log/httpd/access_log -W /apache/ -j |
jgrep -s "data.size"|
awk '{ SUM += $1} END { print SUM/1024/1024 " MB"}'
2757.9093 MB
Now how about interacting with a webservice like the GitHub API:
$ curl -s http://github.com/api/v2/json/commits/list/puppetlabs/marionette-collective/master|
   jgrep --start commits "author.name='Pieter Loubser'" -s id
52470fee0b9fe14fb63aeb344099d0c74eaf7513 |
$ curl -s http://github.com/api/v2/json/commits/list/puppetlabs/marionette-collective/master|
jgrep --start commits "author.name='Pieter Loubser'" -s id
52470fee0b9fe14fb63aeb344099d0c74eaf7513
Here I fetched the most recent commits in the marionette-collective GitHub repository, searched for ones by Pieter and returns the ID of those commits. The –start argument is needed because the top of the JSON returned is not the array we care for. The –start tells jgrep to take the commits key and grep that.
Or since it’s Sysadmin Appreciation Day how about tweets about it:
% curl -s "http://search.twitter.com/search.json?q=sysadminday"|
   jgrep --start results -s "text"

RT @RedHat_Training: Did you know that today is Systems Admin Day?  A big THANK YOU to all our system admins!  Here's to you!  http://t.co/ZQk8ifl
RT @SinnerBOFH: #BOFHers RT @linuxfoundation: Happy #SysAdmin Day! You know who you are, rock stars. http://t.co/kR0dhhc #linux
RT @google: Hey, sysadmins - thanks for all you do. May your pagers be silent and your users be clueful today! http://t.co/N2XzFgw
RT @google: Hey, sysadmins - thanks for all you do. May your pagers be silent and your users be clueful today! http://t.co/y9TbCqb #sysadminday
RT @mfujiwara: http://www.sysadminday.com/
RT @mitchjoel: It's SysAdmin Day! Have you hugged your SysAdmin today? Make sure all employees follow the rules: http://bit.ly/17m98z #humor
? @mfujiwara: http://www.sysadminday.com/ |
% curl -s "http://search.twitter.com/search.json?q=sysadminday"|
jgrep --start results -s "text"
RT @RedHat_Training: Did you know that today is Systems Admin Day? A big THANK YOU to all our system admins! Here's to you! http://t.co/ZQk8ifl
RT @SinnerBOFH: #BOFHers RT @linuxfoundation: Happy #SysAdmin Day! You know who you are, rock stars. http://t.co/kR0dhhc #linux
RT @google: Hey, sysadmins - thanks for all you do. May your pagers be silent and your users be clueful today! http://t.co/N2XzFgw
RT @google: Hey, sysadmins - thanks for all you do. May your pagers be silent and your users be clueful today! http://t.co/y9TbCqb #sysadminday
RT @mfujiwara: http://www.sysadminday.com/
RT @mitchjoel: It's SysAdmin Day! Have you hugged your SysAdmin today? Make sure all employees follow the rules: http://bit.ly/17m98z #humor
? @mfujiwara: http://www.sysadminday.com/
Here as before we have to grep the results array that is contained inside the results.
I can also find all the restaurants near my village via SimpleGEO:
curl -x localhost:8001 -s "http://api.simplegeo.com/1.0/places/51.476959,0.006759.json?category=Restaurant"|
   jgrep --start features "properties.distance<2.0" -s "properties.address \
                                      properties.name \
                                      properties.postcode \
                                      properties.phone \
                                      properties.distance"
[
  {
    "properties.address": "15 Stratheden Road",
    "properties.distance": 0.773576114771768,
    "properties.phone": "+44 20 8858 8008",
    "properties.name": "The Lamplight",
    "properties.postcode": "SE3 7TH"
  },
  {
    "properties.address": "9 Stratheden Parade",
    "properties.distance": 0.870622234751732,
    "properties.phone": "+44 20 8858 0728",
    "properties.name": "Sun Ya",
    "properties.postcode": "SE3 7SX"
  }
] |
curl -x localhost:8001 -s "http://api.simplegeo.com/1.0/places/51.476959,0.006759.json?category=Restaurant"|
jgrep --start features "properties.distance<2.0" -s "properties.address \
properties.name \
properties.postcode \
properties.phone \
properties.distance"
[
{
"properties.address": "15 Stratheden Road",
"properties.distance": 0.773576114771768,
"properties.phone": "+44 20 8858 8008",
"properties.name": "The Lamplight",
"properties.postcode": "SE3 7TH"
},
{
"properties.address": "9 Stratheden Parade",
"properties.distance": 0.870622234751732,
"properties.phone": "+44 20 8858 0728",
"properties.name": "Sun Ya",
"properties.postcode": "SE3 7SX"
}
]
There’s a lot more I didn’t show, it supports all the usual <= etc operators and a fair few other bits.
You can get this utility by installing the jgrep Ruby Gem or grab the code from GitHub. The Gem is a library so you can use these abilities in your ruby programs but also includes the CLI tool shown here.
It’s pretty new code and we’d totally love feedback, bugs and ideas! Follow the author on Twitter at @pieterloubser and send him some appreciation too.
by R.I. Pienaar | Apr 4, 2011 | Code
I’ve been working on rewriting my proof of concept code into actual code I might not feel ashamed to show people, this is quite a slow process so hang in there.
If you’ve been reading my previous posts you’ll know I aim to write a framework for monitoring and event correlation. This is a surprisingly difficult problem space mostly due to the fact that we all have our own ideas of how this should work. I will need to cater literally for all kind of crazy to really be able to call this a framework.
 In the most basic form it just take events, archive them, process metrics, process status and raise alerts. Most people will recognize these big parts in their monitoring systems but will also agree there is a lot more to it than this. What describes the extra bits will almost never be answered in a single description as we all have unique needs and ideas.
The challenge I face is how to make an architecture that can be changed, be malleable to all needs and in effect be composable rather than a prescribed design. These are mostly solved problems in computer science however I do not wish to build a system only usable by comp sci majors. I want to build something that infrastructure developers (read: DevOps) can use to create solutions they need at a speed reaching proof-of-concept velocity while realizing a robust result. These are similar to the goals I had when designing MCollective.
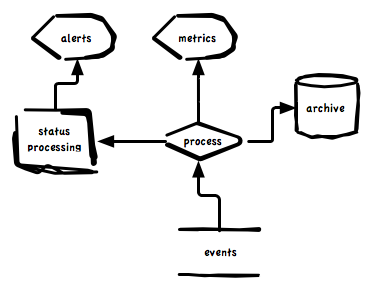
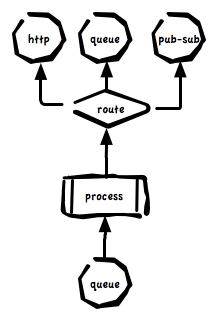
In building the rewrite of the code I opted for this pattern and realized it using middleware and a simple routing system. Routing in middleware is very capable like this post about RabbitMQ describes but this is only part of the problem.
Given the diagram above and given that events can be as simple as a metric for load and as complex as a GitHub commit notify containing sub documents for 100s of commits and can be a mix of metrics, status and archive data we’d want to at least be able to configure these behaviors and 100s like them:
- Only archive a subset of messages
- Only route metrics for certain types of events into Graphite while routing others into OpenTSDB
- Only do status processing on events that has enough information to track state
- Dispatch alerts for server events like load average alerts to a different system than alerts for application level events like payments per hour below a certain threshold. These are often different teams with different escalation procedures.
- Dispatch certain types of metrics to a system that will do alerting based on real time analysis of past trends – this is CPU intensive and you should only subject a subset of events to this processing
- Route a random 10% of the firehose of events into a development environment
- Inject code – in any language – in between 2 existing parts of the event flow and alter the events of route them to a temporary debugging destination.
We really need a routing system that can plug into any part of the architecture and make decisions based on any part of the event.
I’ve created a very simple routing system in my code that plugs all the major components together. Here’s a simple route that sends metrics off to the metric processor. It transforms events that contain metrics into graphite data:
add_route(:name => "graphite", :type => ["metric", "status"]) do |event, routes|
  routes << "stomp:///queue/events.graphite" unless event.metrics.empty?
end |
add_route(:name => "graphite", :type => ["metric", "status"]) do |event, routes|
routes << "stomp:///queue/events.graphite" unless event.metrics.empty?
end
You can see from the code that we have access to the full event, a sample event is below, and we can make decisions based on any part of the event.
{"name":"puppetmaster",
 "eventid":"4d9a33eb2bce3479f50a86e0",
 "text":"PROCS OK: 2 processes with command name puppetmasterd",
 "metrics":{},"tags":{},
 "subject":"monitor2.foo.net",
 "origin":"nagios bridge",
 "type":"status",
 "eventtime":1301951466,
"severity":0} |
{"name":"puppetmaster",
"eventid":"4d9a33eb2bce3479f50a86e0",
"text":"PROCS OK: 2 processes with command name puppetmasterd",
"metrics":{},"tags":{},
"subject":"monitor2.foo.net",
"origin":"nagios bridge",
"type":"status",
"eventtime":1301951466,
"severity":0}
This event is of type status and has no metrics so it would not have been routed to the graphite system, while the event below has no status only metrics:
{"name":"um.bridge.nagios",
 "created_at":1301940072,
 "eventid":"4d9a34462bce3479f50a8839",
 "text":"um internal stats for um.bridge.nagios",
 "metrics":{"events":49},
 "tags":{"version":"0.0.1"},
 "subject":"monitor2.foo.net",
 "origin":"um stat",
 "type":"metric",
 "extended_data":{"start_time":1301940072},
"eventtime":1301951558,"severity":0} |
{"name":"um.bridge.nagios",
"created_at":1301940072,
"eventid":"4d9a34462bce3479f50a8839",
"text":"um internal stats for um.bridge.nagios",
"metrics":{"events":49},
"tags":{"version":"0.0.1"},
"subject":"monitor2.foo.net",
"origin":"um stat",
"type":"metric",
"extended_data":{"start_time":1301940072},
"eventtime":1301951558,"severity":0}
By simply supplying this route:
add_route(:name => "um_status", :type => ["status", "alert"]) do |event, routes|
    routes << "stomp:///queue/events.status"
end |
add_route(:name => "um_status", :type => ["status", "alert"]) do |event, routes|
routes << "stomp:///queue/events.status"
end
I can be sure this non status bearing event of type metric wouldn’t reach the status system where it will just waste resources.
You can see the routing system is very simple and sit at the emitting side of every part of the system. If you wanted to inject code between the main Processor and Graphite here simply route the events to your code and then back into graphite when you’re done transforming the events. As long as you can speak to middleware and process JSON you can inject logic into the flow of events.
I hope this will give me a totally composable infrastructure, I think the routes are trivial enough that almost anyone can write and tweak them and since I am using the most simplest of technologies like JSON almost any language can be used to plug into this framework and consume the events. Routes can be put into the system without restarting anything, just drop the files down and touch a trigger file – the routes will immediately become active.
The last example I want to show is the development route I mentioned above that siphons off roughly 10% of the firehose into your dev systems:
add_route(:name => "development", :type => "*") do |event, routes|
    routes << "stomp:///topic/development.portal" if rand(10) == 1
end |
add_route(:name => "development", :type => "*") do |event, routes|
routes << "stomp:///topic/development.portal" if rand(10) == 1
end
Here I am picking all event types, I am dumping it into a topic called development.portal but only in roughly 10% of cases. We’re using a topic since they dont buffer or store or consume much memory when the development system is down – events will just be lost when the dev system is down.
I’d simply drop this into /etc/um/routes/portal/development.rb to configure my production portal to emit raw events to my development event portal.
That’s all for today, as mentioned this stuff is old technology and nothing here really solves new problems but I think the simplicity of the routing system and how it allows people without huge amounts of knowledge to re-compose code I wrote in new and interesting ways is quite novel in the sysadmin tool space that’s all too rigid and controlled.