by R.I. Pienaar | Jan 6, 2013 | Code
Redis is an in-memory key-value data store that provides a small number of primitives suitable to the task of building monitoring systems. As a lot of us are hacking in this space I thought I’d write a blog post summarizing where I’ve been using it in a little Sensu like monitoring system I have been working on on and off.
There’s some monitoring related events coming up like MonitoringLove in Antwerp and Monitorama in Boston – I will be attending both and I hope a few members in the community will create similar background posts on various interesting areas before these events.
I’ve only recently started looking at Redis but really like it. It’s a very light weight daemon written in C with fantastic documentation detailing things like each commands performance characteristics and most documantation pages are live in that they have a REPL right on the page like the SET page – note you can type into the code sample and see your changes in real time. It is sponsored by VMWare and released under the 3 clause BSD license.
Redis Data Types
Redis provides a few common data structures:
- Normal key-value storage where every key has just one string value
- Hashes where every key contains a hash of key-values strings
- Lists of strings – basically just plain old Arrays sorted in insertion order that allows duplicate values
- Sets are a bit like Lists but with the addition that a given value can only appear in a list once
- Sorted Sets are sets that in addition to the value also have a weight associated with it, the set is indexed by weight
All the keys support things like expiry based on time and TTL calculation. Additionally it also supports PubSub.
At first it can be hard to imagine how you’d use a data store with only these few data types and capable of only storing strings for monitoring but with a bit of creativity it can be really very useful.
The full reference about all the types can be found in the Redis Docs: Data Types
Monitoring Needs
Monitoring systems generally need a number of different types of storage. These are configuration, event archiving and status and alert tracking. There are more but these are the big ticket items, of the 3 I am only going to focus on the last one – Status and Alert Tracking here.
Status tracking is essentially transient data. If you loose your status view it’s not really a big deal it will be recreated quite quickly as new check results come in. Worst case you’ll get some alerts again that you recently got. This fits well with Redis that doesn’t always commit data soon as it receives it – it flushes roughly every second from memory to disk.
Redis does not provide much by way of SSL or strong authentication so I tend to consider it a single node IPC system rather than say a generic PubSub system. I feed data into a node using system like ActiveMQ and then for comms and state tracking on a single node I’ll use Redis.
I’ll show how it can be used to solve the following monitoring related storage/messaging problems:
- Check Status – a check like load on every node
- Staleness Tracking – you need to know when a node is not receiving check results so you can do alive checks
- Event Notification – your core monitoring system will likely feed into alerters like Opsgenie and metric storage like Graphite
- Alert Tracking – you need to know when you last sent an alert and when you can alert again based on an interval like every 2 hours
Check Status
The check is generally the main item of monitoring systems. Something configures a check like load and then every node gets check results for this item, the monitoring system has to track the status of the checks on a per node basis.
In my example a check result looks more or less like this:
{"lastcheck"        => "1357490521",
 "count"            => "1143",
 "exitcode"         => "0",
 "output"           => "OK - load average: 0.23, 0.10, 0.02",
 "last_state_change"=> "1357412507",
 "perfdata"         => '{"load15":0.02,"load5":0.1,"load1":0.23}',
 "check"            => "load",
"host" => "dev2.devco.net"} |
{"lastcheck" => "1357490521",
"count" => "1143",
"exitcode" => "0",
"output" => "OK - load average: 0.23, 0.10, 0.02",
"last_state_change"=> "1357412507",
"perfdata" => '{"load15":0.02,"load5":0.1,"load1":0.23}',
"check" => "load",
"host" => "dev2.devco.net"}
This is standard stuff and the most boring part – you might guess this goes into a Hash and you’ll be right. Note the count item there Redis has special handling for counters and I’ll show that in a minute.
By convention Redis keys are name spaced by a : so I’d store the check status for a specific node + check combination in a key like status:example.net:load
Updating or creating a new hash is real easy – just write to it:
1
2
3
4
5
6
7
8
9
10
11
12
13
14
15
16
17
18
19
20
21
22
23
24
|
def save_check(check)
  key = "status:%s:%s" % [check.host, check.check]

  check.last_state_change = @redis.hget(key, "last_state_change")
  check.previous_exitcode = @redis.hget(key, "exitcode")

  @redis.multi do
    @redis.hset(key, "host", check.host)
    @redis.hset(key, "check", check.check)
    @redis.hset(key, "exitcode", check.exitcode)
    @redis.hset(key, "lastcheck", check.last_check)
    @redis.hset(key, "last_state_change", check.last_state_change)
    @redis.hset(key, "output", check.output)
    @redis.hset(key, "perfdata", check.perfdata)

    unless check.changed_state?
      @redis.hincrby(key, "count", 1)
    else
      @redis.hset(key, "count", 1)
    end
  end

  check.count = @redis.hget(key, "count")
end |
def save_check(check)
key = "status:%s:%s" % [check.host, check.check]
check.last_state_change = @redis.hget(key, "last_state_change")
check.previous_exitcode = @redis.hget(key, "exitcode")
@redis.multi do
@redis.hset(key, "host", check.host)
@redis.hset(key, "check", check.check)
@redis.hset(key, "exitcode", check.exitcode)
@redis.hset(key, "lastcheck", check.last_check)
@redis.hset(key, "last_state_change", check.last_state_change)
@redis.hset(key, "output", check.output)
@redis.hset(key, "perfdata", check.perfdata)
unless check.changed_state?
@redis.hincrby(key, "count", 1)
else
@redis.hset(key, "count", 1)
end
end
check.count = @redis.hget(key, "count")
end
Here I assume we have a object that represents a check result called check and we’re more or less just fetching/updating data in it. I first retrieve the previously saved state of exitcode and last state change time and save those into the object. The object will do some internal state management to determine if the current check result represents a changed state – OK to WARNING etc – based on this information.
The @redis.multi starts a transaction, everything inside the block will be written in an atomic way by the Redis server thus ensuring we do not have any half-baked state while other parts of the system might be reading the status of this check.
As I said the check determines if the current result is a state change when I set the previous exitcode on line 5 this means lines 16-20 will either set the count to 1 if it’s a change or just increment the count if not. We use the internal Redis counter handling on line 17 to avoid having to first fetch the count and then update it and saving it, this saves a round trip to the database.
You can now just retrieve the whole hash with the HGETALL command, even on the command line:
% redis-cli hgetall status:dev2.devco.net:load
 1) "check"
 2) "load"
 3) "host"
 4) "dev2.devco.net"
 5) "output"
 6) "OK - load average: 0.00, 0.00, 0.00"
 7) "lastcheck"
 8) "1357494721"
 9) "exitcode"
10) "0"
11) "perfdata"
12) "{\"load15\":0.0,\"load5\":0.0,\"load1\":0.0}"
13) "last_state_change"
14) "1357412507"
15) "count"
16) "1178" |
% redis-cli hgetall status:dev2.devco.net:load
1) "check"
2) "load"
3) "host"
4) "dev2.devco.net"
5) "output"
6) "OK - load average: 0.00, 0.00, 0.00"
7) "lastcheck"
8) "1357494721"
9) "exitcode"
10) "0"
11) "perfdata"
12) "{\"load15\":0.0,\"load5\":0.0,\"load1\":0.0}"
13) "last_state_change"
14) "1357412507"
15) "count"
16) "1178"
References: Redis Hashes, MULTI, HSET, HINCRBY, HGET, HGETALL
Staleness Tracking
Staleness Tracking here means we want to know when last we saw any data about a node, if the node is not providing information we need to go and see what happened to it. Maybe it’s up but the data sender died or maybe it’s crashed.
This is where we really start using some of the Redis features to save us time. We need to track when last we saw a specific node and then we have to be able to quickly find all nodes not seen within certain amount of time like 120 seconds.
We could retrieve all the check results and check their last updated time and so figure it out but that’s not optimal.
This is what Sorted Lists are for. Remember Sorted Lists have a weight and orders the list by the weight, if we use the timestamp that we last received data at for a host as the weight it means we can very quickly fetch a list of stale hosts.
1
2
3
|
def update_host_last_seen(host, time)
  @redis.zadd("host:last_seen", time, host)
end |
def update_host_last_seen(host, time)
@redis.zadd("host:last_seen", time, host)
end
When we call this code like update_host_last_seen(“dev2.devco.net”, Time.now.utc.to_i) the host will either be added to or updated in the Sorted List based on the current UTC time. We do this every time we save a new result set with the code in the previous section.
To get a list of hosts that we have not seen in the last 120 seconds is really easy now:
1
2
3
|
def get_stale_hosts(age)
  @redis.zrangebyscore("host:last_seen", 0, (Time.now.utc.to_i - age))
end |
def get_stale_hosts(age)
@redis.zrangebyscore("host:last_seen", 0, (Time.now.utc.to_i - age))
end
If we call this with an age like 120 we’ll get an array of nodes that have not had any data within the last 120 seconds.
You can do the same check on the CLI, this shows all the machines not seen in the last 60 seconds:
% redis-cli zrangebyscore host:last_seen 0 $(expr $(date +%s) - 60)
1) "dev1.devco.net" |
% redis-cli zrangebyscore host:last_seen 0 $(expr $(date +%s) - 60)
1) "dev1.devco.net"
Reference: Sorted Sets, ZADD, ZRANGEBYSCORE
Event Notification
When a check result enters the system thats either a state change, a problem or have metrics associated it we’d want to send those on to other pieces of code.
We don’t know or care who those interested parties are we only care that there might be some interested parties – it might be something writing to Graphite or OpenTSDB or both at the same time or something alerting to Opsgenie or Pager Duty. This is a classic use case for PubSub and Redis has a good PubSub subsystem that we’ll use for this.
I am only going to show the metrics publishing – problem and state changes are very similar:
1
2
3
4
5
6
7
8
9
10
11
|
def publish_metrics(check)
  if check.has_perfdata?
    msg = {"metrics" => check.perfdata, "type" => "metrics", "time" => check.last_check, "host" => check.host, "check" => check.check}.to_json
    publish(["metrics", check.host, check.check], msg)
  end
end

def publish(type, message)
  target = ["overwatch", Array(type).join(":")].join(":")
  @redis.publish(target, message)
end |
def publish_metrics(check)
if check.has_perfdata?
msg = {"metrics" => check.perfdata, "type" => "metrics", "time" => check.last_check, "host" => check.host, "check" => check.check}.to_json
publish(["metrics", check.host, check.check], msg)
end
end
def publish(type, message)
target = ["overwatch", Array(type).join(":")].join(":")
@redis.publish(target, message)
end
This is pretty simple stuff, we’re just publishing some JSON to a named destination like overwatch:metrics:dev1.devco.net:load. We can now write small standalone single function tools that consume this stream of metrics and send it wherever we like – like Graphite or OpenTSDB.
We publish similar events for any incoming check result that is not OK and also for any state transition like CRITICAL to OK, these would be consumed by alerter handlers that might feed pagers or SMS.
We’re publishing these alerts to to destinations that include the host and specific check – this way we can very easily create individual host views of activity by doing pattern based subscribes.
Reference: PubSub, PUBLISH
Alert Tracking
Alert Tracking means keeping track of which alerts we’ve already sent and when we’ll need to send them again like only after 2 hours of the same problem and not on every check result which might come in every minute.
Leading on from the previous section we’d just consume the problem and state change PubSub channels and react on messages from those:
A possible consumer of this might look like this:
1
2
3
4
5
6
7
8
9
10
11
12
13
14
|
@redis.psubscribe("overwatch:state_change:*", "overwatch:issues:*") do |on|
  on.pmessage do |channel, message|
    event = JSON.parse(message)

    case event["type"]
      when "issue"
        sender.notify_issue(event["issue"]["exitcode"], event["host"], event["check"], event["issue"]["output"])
      when "state_change"
        if event["state_change"]["exitcode"] == 0
          sender.notify_recovery(event["host"], event["check"], event["state_change"]["output"])
        end
    end
  end
end |
@redis.psubscribe("overwatch:state_change:*", "overwatch:issues:*") do |on|
on.pmessage do |channel, message|
event = JSON.parse(message)
case event["type"]
when "issue"
sender.notify_issue(event["issue"]["exitcode"], event["host"], event["check"], event["issue"]["output"])
when "state_change"
if event["state_change"]["exitcode"] == 0
sender.notify_recovery(event["host"], event["check"], event["state_change"]["output"])
end
end
end
end
This subscribes to the 2 channels and pass the incoming events to a notifier. Note we’re using the patterns here to catch all alerts and changes for all hosts.
The problem here is that without any special handling this is going to fire off alerts every minute assuming we check the load every minute. This is where Redis expiry of keys come in.
We’ll need to track which messages we have sent when and on any state change clear the tracking thus restarting the counters.
So we’ll just add keys called “alert:dev2.devco.net:load:3” to indicate an UNKNOWN state alert for load on dev2.devco.net:
1
2
3
4
5
|
def record_alert(host, check, status, expire=7200)
  key = "alert:%s:%s:%d" % [host, check, status]
  @redis.set(key, 1)
  @redis.expire(key, expire)
end |
def record_alert(host, check, status, expire=7200)
key = "alert:%s:%s:%d" % [host, check, status]
@redis.set(key, 1)
@redis.expire(key, expire)
end
This takes an expire time which defaults to 2 hours and tells redis to just remove the key when its time is up.
With this we need a way to figure out if we can send again:
1
2
3
4
|
def alert_ttl(host, check, status)
  key = "alert:%s:%s:%d" % [host, check, status]
  @redis.ttl(key)
end |
def alert_ttl(host, check, status)
key = "alert:%s:%s:%d" % [host, check, status]
@redis.ttl(key)
end
This will return the amount of seconds till next alert and -1 if we are ready to send again
And finally on every state change we need to just purge all the tracking for a given node + check combo. The reason for this is if we notified on CRITICAL a minute ago then the service recovers to OK but soon goes to CRITICAL again this most recent CRITICAL alert will be suppressed as part of the previous cycle of alerts.
1
2
3
|
def clear_alert_ttls(host, check)
  @redis.del(@redis.keys.grep(/^alert:#{host}:#{check}:\d/))
end |
def clear_alert_ttls(host, check)
@redis.del(@redis.keys.grep(/^alert:#{host}:#{check}:\d/))
end
So now I can show the two methods that will actually publish the alerts:
The first notifies of issues but only every @interval seconds and it uses the alert_ttl helper above to determine if it should or shouldn’t send:
1
2
3
4
5
6
7
8
9
10
11
12
|
def notify_issue(exitcode, host, check, output)
  if (ttl = @storage.alert_ttl(host, check, exitcode)) == -1
    subject = "%s %s#%s" % [status_for_code(exitcode), host, check]
    message = "%s: %s" % [subject, output]

    send(message, subject, @recipients)

    @redis.record_alert(host, check, exitcode, @alert_interval)
  else
    Log.info("Not alerting %s#%s due to interval restrictions, next alert in %d seconds" % [host, check, ttl])
  end
end |
def notify_issue(exitcode, host, check, output)
if (ttl = @storage.alert_ttl(host, check, exitcode)) == -1
subject = "%s %s#%s" % [status_for_code(exitcode), host, check]
message = "%s: %s" % [subject, output]
send(message, subject, @recipients)
@redis.record_alert(host, check, exitcode, @alert_interval)
else
Log.info("Not alerting %s#%s due to interval restrictions, next alert in %d seconds" % [host, check, ttl])
end
end
The second will publish recovery notices and we’d always want those and they will not repeat, here we clear all the previous alert tracking to avoid incorrect alert surpressions:
1
2
3
4
5
6
7
8
|
def notify_recovery(host, check, output)
  subject = "RECOVERY %s#%s" % [host, check]
  message = "%s: %s" % [subject, output]

  send_alert(message, subject, @recipients)

  @redis.clear_alert_ttls(host, check)
end |
def notify_recovery(host, check, output)
subject = "RECOVERY %s#%s" % [host, check]
message = "%s: %s" % [subject, output]
send_alert(message, subject, @recipients)
@redis.clear_alert_ttls(host, check)
end
References: SET, EXPIRE, SUBSCRIBE, TTL, DEL
Conclusion
This covered a few Redis basics but it’s a very rich system that can be used in many areas so if you are interested spend some quality time with its docs.
Using its facilities saved me a ton of effort while working on a small monitoring system. It is fast and light weight and enable cross language collaboration that I’d have found hard to replicate in a performant manner without it.
by R.I. Pienaar | Oct 2, 2011 | Code
I’ve blogged a lot about a new kind of monitoring but what I didn’t point out is that I do actually like the existing toolset.
I quite like Nagios. It’s configuration is horrible yes, the web ui is near useless, it throws away useful information like perfdata. It is though a good poller, it’s solid, never crashes, doesn’t use too much resources and have created a fairly decent plugin protocol (except for it’s perfdata representation).
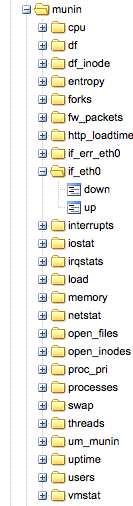 I am at two minds about munin, I like munin-node and the plugin model. I love that there are 100s of plugins available already. I love the introspection that let’s machines discover their own capabilities. But I hate everything about the central munin poller that’s supposed to be able to scale and query all your servers and pre-create graphs. It simply doesn’t work, even on a few 100 machines it’s a completely broken model.
So I am trying to find ways to keep these older tools – and their collective thousands of plugins – around but improve things to bring them into the fold of my ideas about monitoring.
For munin I want to get rid of the central poller, I’d rather have each node produce its data and push it somewhere. In my case I want to put the data into a middleware queue and process the data later into an archive or graphite or some other system like OpenTSDB. I had a look around for some Ruby / Munin integrations and came across a few, I only investigated 2.
Adam Jacob has a nice little munin 2 graphite script that simply talks straight to graphite, this might be enough for some of you so check it out. I also found munin-ruby from Dan Sosedoff which is what I ended up using.
Using the munin-ruby code is really simple:
#!/usr/bin/ruby

require 'rubygems'
require 'munin-ruby'

# connect to munin on localhost
munin = Munin::Node.new("localhost", :port => 4949)

# get each service and print it's metrics
munin.services.each do |service|
   puts "Metrics for service: #{service}"

   munin.service(service).params.each_pair do |k, v|
      puts "   #{k} => #{v}"
   end

   puts
end |
#!/usr/bin/ruby
require 'rubygems'
require 'munin-ruby'
# connect to munin on localhost
munin = Munin::Node.new("localhost", :port => 4949)
# get each service and print it's metrics
munin.services.each do |service|
puts "Metrics for service: #{service}"
munin.service(service).params.each_pair do |k, v|
puts " #{k} => #{v}"
end
puts
end
This creates output like this:
Metrics for service: entropy
   entropy => 174

Metrics for service: forks
forks => 7114853 |
Metrics for service: entropy
entropy => 174
Metrics for service: forks
forks => 7114853
So from here it’s not far to go to get these events onto my middleware, I turn them into JSON blobs like, the last one is a stat about the collector:
{"name":"munin","text":"entropy","subject":"devco.net","tags":{},"metrics":{"entropy.entropy":"162"},"origin":"munin","type":"metric","event_time":1317548538,"severity":0}
{"name":"munin","text":"forks","subject":"devco.net","tags":{},"metrics":{"forks.forks":"7115300"},"origin":"munin","type":"metric","event_time":1317548538,"severity":0}
{"name":"munin","text":"","subject":"devco.net","tags":{},"metrics":{"um_munin.time":3.722587,"um_munin.services":27,"um_munin.metrics":109,"um_munin.sleep":4},"origin":"munin","type":"metric","event_time":1317548538,"severity":0} |
{"name":"munin","text":"entropy","subject":"devco.net","tags":{},"metrics":{"entropy.entropy":"162"},"origin":"munin","type":"metric","event_time":1317548538,"severity":0}
{"name":"munin","text":"forks","subject":"devco.net","tags":{},"metrics":{"forks.forks":"7115300"},"origin":"munin","type":"metric","event_time":1317548538,"severity":0}
{"name":"munin","text":"","subject":"devco.net","tags":{},"metrics":{"um_munin.time":3.722587,"um_munin.services":27,"um_munin.metrics":109,"um_munin.sleep":4},"origin":"munin","type":"metric","event_time":1317548538,"severity":0}
The code that creates and sends this JSON can be seen here, it’s probably useful just to learn from and create your own as that’s a bit specific to me.
Of course my event system already has the infrastructure to turn these JSON events into graphite data that you can see in the image attached to this post so this was a really quick win.
The remaining question is about presentation, I want to create some kind of quick node view system like Munin has. I loved the introspection that you can do to a munin node to discover graph properties there might be something there I can use otherwise I’ll end up making a simple viewer for this.
I imagine for each branch of the munin data like cpu I can either by default just show all the data or take hints from a small DSL no how to present the data there. You’d need to know that some data needs to be derived or used as guages etc. More on that when I had some time to play.
by R.I. Pienaar | Aug 14, 2011 | Uncategorized
A while ago Techcrunch profiled a company called Nodeable who closed 2 mil funding. They bill themselves as a social network for servers and have some cartoon and a beta invite box on their site but no actual usable information. I signed up but never heard from them. So I’ve not seen what they’re doing at all.
Either way I thought the idea sucked.
Since then I kept coming back to it thinking maybe it’s not bad at all, I’ve seen many companies try to include the rest of the business into the status of their networks with big graph boards and complex alerting that is perhaps not suited to the audience.
These experiments often fail and cause more confusion than clarity as the underlying systems are not designed to be friendly to business people. I had a quick twitter convo with @patrickdebois too and a few people on ##infra-talk were keen on the idea. It’s not really a surprise that a lot of us want to make the events stream of our systems more accessible to the business and other interested parties.
 So I setup a copy of status.net – actually I used the excellent appliance from Turnkey Linux and it took 10 minutes. I gave each of my machines an account with the username being their MAC address and hooked into my existing event stream, it was all less than 150 lines of code and the result is quite pleasing.
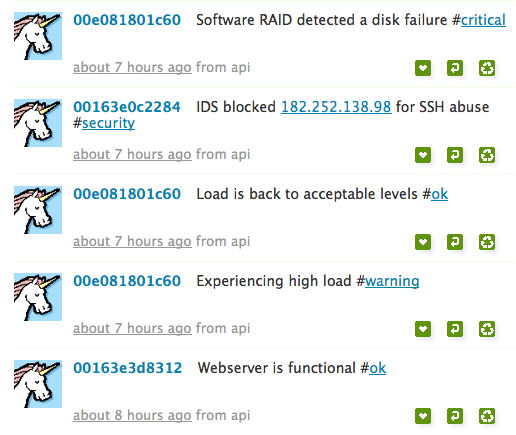
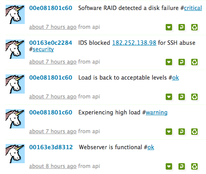
What makes this compelling is specifically that it is void of technical details, no mention of /dev/sda1 and byte counts and percentages that makes text hard to scan or understand by non tech people. Just simple things like Experiencing high load #warning This is something normal people can easily digest. It’s small enough to scan really quickly and for many users this is all they need to know.
At the moment I have Puppet changes, IDS events and Nagios events showing up on a twitter like timeline for all my machines. I hash tag the tweets using things like #security, #puppet, and #fail for failing puppet resources. #critical, #warning, #ok for nagios etc. I plan on also adding hash tags matching machine roles as captured in my CM. Click on the image to the right for a bigger example.
Status.net is unfortunately not the tool to build this on, it’s simply too buggy and too limited. You can make groups and add machines to groups but this isn’t something like Twitters lists thats user managed, I can see a case where a webmaster will just add the machines he knows his apps runs on in a list and follow that. You can’t easily do this with status.net. My machines has their fqdn as real names, why on earth status.net doesn’t show real names in the timeline I don’t get, I hope it’s a setting I missed. I might look towards something like Yammer for this or if Nodable eventually ships something that might do.
I think the idea has a lot of merit. If I think about the 500 people I follow on twitter, its hard work but not at all unmanageable and you would hope those 500 people are more chatty than a well managed set of servers. The tools we already use like lists, selective following, hashtags and clients for mobiles, desktop, email notifications and RSS all apply to this use case.
Imagine your servers profile information contained a short description of function. The contact email address is the team responsible for it. The geo information is datacenter coordinates. You could identify ‘hot spots’ in your infrastructure by just looking at tweets on a map. Just like we do with tweets for people.
I think the idea has legs, status.net is a disappointment. I am quite keen to see what Nodeable comes out with and I will keep playing with this idea.
by R.I. Pienaar | Jul 3, 2011 | Uncategorized
I’ve wanted to be notified the moment Puppet changes a resource for ages, I’ve often been told this cannot be done without monkey patching nasty Puppet internals.
Those following me on Twitter have no doubt noticed my tweets complaining about the complexities in getting this done. I’ve now managed to get this done so am happy to share here.
 The end result is that my previously mentioned event system is now getting messages sent the moment Puppet does anything. And I have callbacks at the event system layer so I can now instantly react to change anywhere on my network.
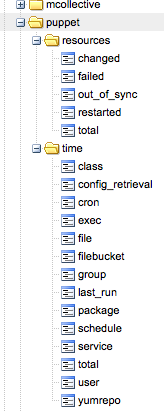
If a new webserver in a certain cluster comes up I can instantly notify the load balancer to add it – perhaps via a Puppet run of of its own. This lets me build reactive cross node orchestration. Apart from the callbacks I also get run metrics in Graphite as seen in the image.
The best way I found to make Puppet do this is by creating your own transaction reports processor that is the client side of a normal puppet report, here’s a shortened version of what I did. It’s overly complex and a pain to get working since Puppet Pluginsync still cannot sync out things like Applications.
The code overrides the finalize_report method to send the final run metrics and the add_resource_status method to publish events for changing resources. Puppet will use the add_resource_status method to add the status of a resource right after evaluating that resource. By tapping into this method we can send events to the network the moment the resource has changed.
require 'puppet/transaction/report'

class Puppet::Transaction::UnimatrixReport < Puppet::Transaction::Report
  def initialize(kind, configuration_version=nil)
    super(kind, configuration_version)

    @um_config = YAML.load_file("/etc/puppet/unimatrix.yaml")
  end

  def um_connection
    @um_connection ||= Stomp::Connection.new(@um_config[:user], @um_config[:password], @um_config[:server], @um_config[:port], true)
  end

  def um_newevent
    event = { ... } # skeleton event, removed for brevity
  end

  def finalize_report
    super

    metrics = um_newevent
    sum = raw_summary

    # add run metrics from raw_summary to metrics, removed for brevity

    Timeout::timeout(2) { um_connection.publish(@um_config[:portal], metrics.to_json) }
  end

  def add_resource_status(status)
    super(status)

    if status.changed?
      event = um_newevent

      # add event status to event hash, removed for brevity

      Timeout::timeout(2) { um_connection.publish(@um_config[:portal], event.to_json) }
    end
  end
end |
require 'puppet/transaction/report'
class Puppet::Transaction::UnimatrixReport < Puppet::Transaction::Report
def initialize(kind, configuration_version=nil)
super(kind, configuration_version)
@um_config = YAML.load_file("/etc/puppet/unimatrix.yaml")
end
def um_connection
@um_connection ||= Stomp::Connection.new(@um_config[:user], @um_config[:password], @um_config[:server], @um_config[:port], true)
end
def um_newevent
event = { ... } # skeleton event, removed for brevity
end
def finalize_report
super
metrics = um_newevent
sum = raw_summary
# add run metrics from raw_summary to metrics, removed for brevity
Timeout::timeout(2) { um_connection.publish(@um_config[:portal], metrics.to_json) }
end
def add_resource_status(status)
super(status)
if status.changed?
event = um_newevent
# add event status to event hash, removed for brevity
Timeout::timeout(2) { um_connection.publish(@um_config[:portal], event.to_json) }
end
end
end
Finally as I really have no need for sending reports to my Puppet Masters I created a small Application that replace the standard agent. This application has access to the report even when reporting is disabled so it will never get saved to disk or copied to the masters.
This application sets up the report using the class above and creates a log destination that feeds the logs into it. This is more or less exactly the Puppet::Application::Agent so I retain all my normal CLI usage like –tags and –test etc.
require 'puppet/application'
require 'puppet/application/agent'
require 'rubygems'
require 'stomp'
require 'json'

class Puppet::Application::Unimatrix < Puppet::Application::Agent
  run_mode :unimatrix

  def onetime
    unless options[:client]
      $stderr.puts "onetime is specified but there is no client"
      exit(43)
      return
    end

    @daemon.set_signal_traps

    begin
      require 'puppet/transaction/unimatrixreport'
      report = Puppet::Transaction::UnimatrixReport.new("unimatrix")

      # Reports get logs, so we need to make a logging destination that understands our report.
      Puppet::Util::Log.newdesttype :unimatrixreport do
        attr_reader :report

        match "Puppet::Transaction::UnimatrixReport"

        def initialize(report)
          @report = report
        end

        def handle(msg)
          @report << msg
        end
      end

      @agent.run(:report => report)
    rescue => detail
      puts detail.backtrace if Puppet[:trace]
      Puppet.err detail.to_s
    end

    if not report
      exit(1)
    elsif options[:detailed_exitcodes] then
      exit(report.exit_status)
    else
      exit(0)
    end
  end
end |
require 'puppet/application'
require 'puppet/application/agent'
require 'rubygems'
require 'stomp'
require 'json'
class Puppet::Application::Unimatrix < Puppet::Application::Agent
run_mode :unimatrix
def onetime
unless options[:client]
$stderr.puts "onetime is specified but there is no client"
exit(43)
return
end
@daemon.set_signal_traps
begin
require 'puppet/transaction/unimatrixreport'
report = Puppet::Transaction::UnimatrixReport.new("unimatrix")
# Reports get logs, so we need to make a logging destination that understands our report.
Puppet::Util::Log.newdesttype :unimatrixreport do
attr_reader :report
match "Puppet::Transaction::UnimatrixReport"
def initialize(report)
@report = report
end
def handle(msg)
@report << msg
end
end
@agent.run(:report => report)
rescue => detail
puts detail.backtrace if Puppet[:trace]
Puppet.err detail.to_s
end
if not report
exit(1)
elsif options[:detailed_exitcodes] then
exit(report.exit_status)
else
exit(0)
end
end
end
And finally I can now create a callback in my event system this example is over simplified but the gist of it is that I am triggering a Puppet run on my machines with class roles::frontend_lb as a result of a web server starting on any machine with the class roles::frontend_web – effectively immediately causing newly created machines to get into the pool. The Puppet run is triggered via MCollective so I am using it’s discovery capabilities to run all the instances of load balancers.
add_callback(:name => "puppet_change", :type => ["archive"]) do |event|
   data = event["extended_data"]

   if data["resource_title"] && data["resource_type"]
      if event["name"] == "Service[httpd]"
         # only when its a new start, this is short for brevity you want to do some more checks
         if data["restarted"] == false && data["tags"].include?("roles::frontend_web")
           # does a puppet run via mcollective on the frontend load balancer
           UM::Util.run_puppet(:class_filter => "roles::frontend_lb")
         end
     end
  end
end |
add_callback(:name => "puppet_change", :type => ["archive"]) do |event|
data = event["extended_data"]
if data["resource_title"] && data["resource_type"]
if event["name"] == "Service[httpd]"
# only when its a new start, this is short for brevity you want to do some more checks
if data["restarted"] == false && data["tags"].include?("roles::frontend_web")
# does a puppet run via mcollective on the frontend load balancer
UM::Util.run_puppet(:class_filter => "roles::frontend_lb")
end
end
end
end
Doing this via a Puppet run demonstrates to me where the balance lie between Orchestration and CM. You still need to be able to build a new machine, and that new machine needs to be in the same state as those that were managed using the Orchestration tool. So by using MCollective to trigger Puppet runs I know I am not doing anything out of bounds of my CM system, I am simply causing it to work when I want it to work.
by R.I. Pienaar | May 4, 2011 | Uncategorized
This is a follow-up post to other posts I’ve done regarding a new breed of monitoring that I hope to create.
I’ve had some time to think about configuration of monitoring. This is a big pain point in all monitoring systems. Many require you configure all your resources, dependencies etc often in text files. Others have API that you can automate against and the worst ones have only a GUI.
In the modern world where we have configuration management this end up being a lot of duplication, your CM system already knows about inter dependencies etc. Your CM’s facts system could know about contacts for a machine and I am sure we could derive a lot of information from these catalogs. Today bigger sites tend to automate the building of monitor config files using their CM systems but it tends to be slow to adapt to network conditions and it’s quite a lot of work.
I spoke a bit about this in the CMDB session at Puppet Camp so thought I’d lay my thoughts down somewhere proper as I’ve been talking about this already.
I’ve previously blogged about using MCollective for monitoring based on discovery. In that post I pointed out that not all things are appropriate to be monitored using this method as you don’t know what is down. There is an approach to solving this problem though. MCollective supports building databases of what should be there – it’s called Registration. By correlating the discovered information with the registered information you can defer what is absent/unknown or down.
Ideally this is as much configuration as I want to have for monitoring mail queue sizes on all my smart hosts:
scheduler.every '1m' do
    nrpe("check_mailq", :cf_class => "exim::smarthost")
end |
scheduler.every '1m' do
nrpe("check_mailq", :cf_class => "exim::smarthost")
end
This still leaves a huge problem, I can ask for my a specific service to be monitored on a subset of machines but I cannot defer parent child relationships or know who to notify and this is a huge problem.
Now as I am using Puppet to declare these services and using Puppet based discovery to select which machines to monitor I would like to declare parent child relationships in Puppet even cross-node ones.
 The approach we are currently testing is around loading all my catalogs for all my machines into Neo4J – a purpose built graph database. I am declaring relationships in the manifests and post processing the graph to create the cross node links.
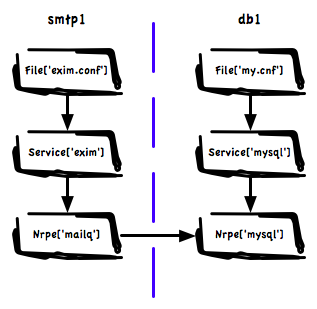
This means we have a huge graph of graphs containing all inter node dependencies. The image shows visually how a small part of this might look. Here we have a Exim service that depends on a database on a different machine because we use a MySQL based Greylisting service.
Using this graph we can answer many questions, among others:
- When doing notifications on a failure in MySQL do not notify about mailq on any of the mail servers
- What other services are affected by a failure on the MySQL Server, if you exposed this to your NOC in a good UI you’ll have to maintain a whole lot less documentation and they know who to call.
- If we are going to do maintenance on the MySQL server what related systems should we schedule downtime on
- What single points of failure exist in the infrastructure
- While planning maintenance on shared resources in big teams with many different groups using databases, find all stake holders
- Create action rule that will shut down all Exim cleanly after failure of the MySQL – mail will spool safely at senders
If we combine this with a rich set of facts we can create a testing framework – perhaps something cucumber based – that let us express infrastructure tests. Platform managers should be able to express baseline design principles the various teams should comply to. These tests are especially important in dynamic environments like ones managed by cloud auto scalers:
- Find all machines with no declared dependencies
- Write a test to check that all shards in a MongoDB cluster has more than 1 member
- Make sure all our MySQL databases are not in the same availability zone
- Find services that depend on each other but that co-habit in the same rack.
- If someone accidentally removes a class from Puppet that manage a DB machine, alert on all failed dependencies that are now unmanaged
And finally we can create automated queries into this database:
- When auto scaling make sure we never end up shutting down machines that would break a dependency
- For an outage on the MySQL server find all related node and their contact information, notify the right people
- When adding nodes using auto scalers make sure we start nodes in different availability zones. If we overlay latency information we can intelligently pick the fastest non-local zone to place a node
The possibilities of pulling in graphs from CM all into one huge queryable data source that understands structure and relationships is really endless. You can see how we have enough information here to derive all the parent child relationships we need for intelligent monitoring.
Ideally Puppet itself would support cross node dependencies but I think that’s some way off. So we have created a hacky solution to declare the relationships now. I think though we need a rich set of relationships. Hard relationships like we have in Puppet now where failure will cause other resources to fail. But we might also have soft relationships that just exist to declare relationships that other systems like monitoring will query.
This is a simple overview of what I have in mind, I expect in the next day or three a follow up post by a co-worker that will show some of the scripts we’ve been working on showing actual queries over this huge graph. We have it working, just polishing things up a bit still.
On a side note, I think one of the biggest design wins in Puppet is that it’s data based. It’s not just a bunch of top-down scripts being run like your old Bash scripts you used to build boxes. Its a directed graph with relationships, that’s queryable and can be used to build other systems, this is a big deal in next generational thinking about systems and I think the above post highlights just a small number of the possibilities this graph brings.