by R.I. Pienaar | Jun 14, 2013 | Uncategorized
I’ve not had a good introduction to MCollective slide deck ever, I usually just give demos and talk through it. I was invited to talk in San Francisco about MCollective so made a new deck for this talk.
On the night I gave people the choice of talks between the new Introduction talk and the older Managing Puppet using MCollective and sadly the intro talk lost out.
Last night the excellent people at Workday flew me to Dublin to talk to the local DevOps group there and this group was predominantly Chef users who chose the Introduction talk so I finally had a chance to deliver it. This talk was recorded, hopefully it’ll be up soon and I’ll link to it once available.
This slide deck is a work in progress, it’s clear I need to add some more information about the non-cli orientated uses of MCollective but it’s good to finally have a deck that’s receiving good feedback.
We uploaded the slides back when I was in San Francisco to slideshare and those are the ones you see here.
by R.I. Pienaar | Feb 3, 2013 | Uncategorized
I recently gave a talk titled “Managing Puppet Using MCollective” at the Puppet Camp in Ghent.
The talk introduces a complete rewrite of the MCollective plugin used to manage Puppet. The plugin can be found on our Github repo as usual. Significantly this is one of a new breed of plugin that we ship as native OS packages and practice continuous delivery on.
The packages can be found on apt.puppetlabs.com and yum.puppetlabs.com and are simply called mcollective-puppet-agent and mcollective-puppet-client.
This set of plugins show case a bunch of recent MCollective features including:
- Data Plugins
- Aggregation Functions
- Custom Validators
- Configurable enabling and disabling of the Agent
- Direct Addressing and pluggable discovery to significantly improve the efficiency of the runall method
- Utility classes shared amongst different types of plugin
- Extensive testing using rspec and our mcollective specific rspec plugins
It’s a bit of a beast coming at a couple thousand lines but this was mostly because we had to invent a rather sizeable wrapper for Puppet to expose a nice API around Puppet 2.7 and 3.x for things like running them and obtaining their status.
The slides from the talk can be seen below, hopefully a video will be up soon else I’ll turn it into a screencast.
by R.I. Pienaar | Jan 20, 2013 | Uncategorized
I’ve recently been thinking about ways to do graphs on the CLI. We’ve written a new Puppet Agent for MCollective that can gather all sorts of interesting data from your server estate and I’d really like to be able to show this data on the CLI. This post isn’t really about MCollective though the ideas applies to any data.
I already have sparklines in MCollective, here’s the distribution of ping times:
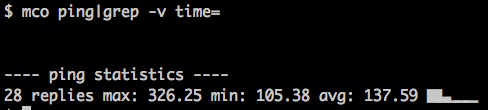
This shows you that most of the nodes responded quickly with a bit of a tail at the end being my machines in the US.
Sparklines are quite nice for a quick overview so I looked at adding some more of this to the UI and came up with this:
Which is quite nice – these are the nodes in my infrastructure stuck into buckets and the node counts for each bucket is shown. We can immediately tell something is not quite right – the config retrieval time shows a bunch of slow machines and the slowness does not correspond to resource counts etc. On investigation I found these are my dev machines – KVM nodes hosted on HP Micro Servers so that’s to be expected.
I am not particularly happy with these graphs though so am still exploring other options, one other option is GNU Plot.
GNU Plot can target its graphs for different terminals like PNG and also line printers – since the Unix terminal is essentially a line printer we can use this.
Here are 2 graphs of config retrieval time produced by MCollective using the same data source that produced the spark line above – though obviously from a different time period. Note that the axis titles and graph title is supplied automatically using the MCollective DDL:
$ mco plot resource config_retrieval_time

                   Information about Puppet managed resources
  Nodes
    6 ++-*****----+----------+-----------+----------+----------+----------++
      +      *    +          +           +          +          +           +
      |       *                                                            |
    5 ++      *                                                           ++
      |       *                                                            |
      |        *                                                           |
    4 ++       *      *                                                   ++
      |        *      *                                                    |
      |         *    * *                                                   |
    3 ++        *    * *                                                  ++
      |          *  *  *                                                   |
      |           * *   *                                                  |
    2 ++           *    *                         *        *              ++
      |                 *                         **       **              |
      |                  *                       * *      *  *             |
    1 ++                 *               *       *  *     *   **        * ++
      |                  *              * *     *   *     *     **    **   |
      +           +       *  +         * + *    *   +*   *     +     *     +
    0 ++----------+-------*************--+--****----+*****-----+--***-----++
      0           10         20          30         40         50          60
Config Retrieval Time |
$ mco plot resource config_retrieval_time
Information about Puppet managed resources
Nodes
6 ++-*****----+----------+-----------+----------+----------+----------++
+ * + + + + + +
| * |
5 ++ * ++
| * |
| * |
4 ++ * * ++
| * * |
| * * * |
3 ++ * * * ++
| * * * |
| * * * |
2 ++ * * * * ++
| * ** ** |
| * * * * * |
1 ++ * * * * * ** * ++
| * * * * * * ** ** |
+ + * + * + * * +* * + * +
0 ++----------+-------*************--+--****----+*****-----+--***-----++
0 10 20 30 40 50 60
Config Retrieval Time
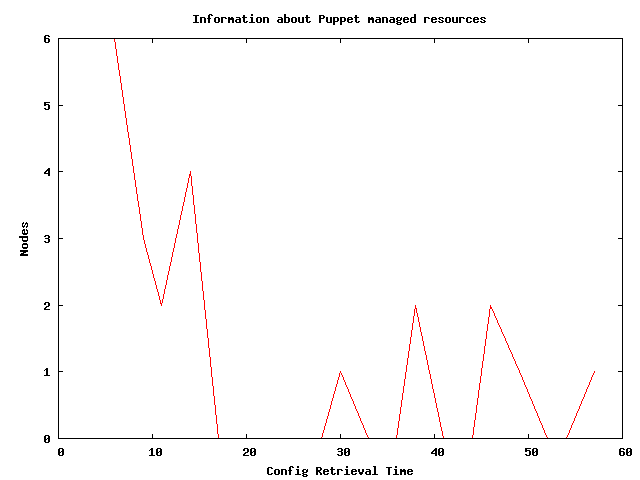
So this is pretty serviceable for showing this data on the console! It wouldn’t scale to many lines but for just visualizing some arbitrary series of numbers it’s quite nice. Here’s the GNU Plot script that made the text graph:
set title "Information about Puppet managed resources"
set terminal dumb 78 24
set key off
set ylabel "Nodes"
set xlabel "Config Retrieval Time"
plot '-' with lines
3 6
6 6
9 3
11 2
14 4
17 0
20 0
22 0
25 0
28 0
30 1
33 0
36 038 2
41 0
44 0
46 2
49 1
52 0
54 0
57 1 |
set title "Information about Puppet managed resources"
set terminal dumb 78 24
set key off
set ylabel "Nodes"
set xlabel "Config Retrieval Time"
plot '-' with lines
3 6
6 6
9 3
11 2
14 4
17 0
20 0
22 0
25 0
28 0
30 1
33 0
36 038 2
41 0
44 0
46 2
49 1
52 0
54 0
57 1
The magic here comes from the second line that sets the output terminal to dump and supplies some dimensions. Very handy, worth exploring some more and adding to your toolset for the CLI. I’ll look at writing a gem or something that supports both these modes.
There are a few other players in this space, I definitely recall coming across a Python tool to do graphs but cannot find it now, shout out in the comments if you know other approaches and I’ll add them to the post!
Updated: some links to related projects: sparkler, Graphite Spark
by R.I. Pienaar | Jun 19, 2012 | Code, Uncategorized
As mentioned in my first post in this series I will be covering new MCollective features that were introduced with version 2.0.0 or later. Today I’ll talk about the biggest new feature called Direct Addressing.
The Past – Broadcast Only Mode
In the past MCollective only had one mode of communication. It would send a broadcast message to all nodes with the target agent in a named group (subcollective) and this message would have a filter attached that nodes will validate to determine if they should run the action. Basically if I send a message with a filter “country=uk” all machines will get it and validate this filter, the ones that match will act on the message.
This mode is the first problem I set out to solve – a way to have a broadcast based zero config RPC system that can address many machines in parallel with a new style of addressing. I wanted to get the broadcast model right first and I wanted to get the RPC structures right as well before looking at other possibilities.
There were many 1:1 RPC systems before and it’s not a very hard problem to solve if you have a queue – but it was not the problem I set out to solve as my first target. MCollective 1.2.1 and older did not have a 1:1 mode.
The parallel mode works fine in many scenarios, specifically this is the only real way to build a central coordinator that degrades well in split brain scenarios since addressing is done by discovery and only discovered nodes are expected to reply. It’s a new paradigm – one thats better suited for distributed applications since failure is inevitable you may as well code your applications to always work in that environment.
I think MCollective solved that problem well in the past but the very nature of that mode of communication means it is not suitable for all use cases. The unsuitable usage include some of the points below but there are of course others:
- If you want to deploy to a pre-determined set of hosts you really want to be sure they get your request and get warnings if they dont
- The broadcast mode is very fast and parallel, you might want to do rolling restarts
- The broadcast only operates with a concept of now, you might know a machine is being provisioned and soon as its up you want it to run your command that you sent 10 minutes ago
- Your discovery needs might not map onto what MCollective support, like when you present users with a host list they can pick arbitrary hosts from
There are many similar problems that was awkward to fit into the MCollective model in the past, all related to either trying to live outside its idea of addressing or about slowing it down to a pace suitable for rolling changes.
Messaging Rewrite
As of 2.0.0 we now have a fairly large rewrite of the messaging subsystem to be more generic and extendable but it also introduce a new mode of addressing that allows you to provide the host list in any way you want. Rather than doing a broadcast for these requests it will communicate only with the specified nodes.
The history of MCollective is that it used to be a in-house unpublished project that was made pluggable and open sourced. The initial release did a OK job of it but the messaging had a bunch of badly coupled decisions all over the code base that was a legacy left over. In 2.0.0 we’re rewritten all of this and abstracted all the actual communication with the middleware away from MCollective core. This made it much easier to change how we approach messaging.
Armed with the 2nd mode of communication we were able to apply the very same existing RPC system to a second more traditional style of addressing and we’re able to mix and match freely between these modes when appropriate. In 2.0.0 this is all kind of under the covers and accessible to the API only but in the new development series – 2.1.x – there has already been a bunch of new user facing features added thanks to this new mode.
Best is to show some code, here’s a traditional discovery based approach to running and action against some machines. The example will just restart apache on some machines:
c = rpcclient("service")

c.fact_filter "country=uk"

printrpc c.restart(:service => "httpd") |
c = rpcclient("service")
c.fact_filter "country=uk"
printrpc c.restart(:service => "httpd")
This code sets the fact_filter which it will get via discovery and then communicates with those hosts. You’re basically here at the mercy of the network and current status of those machines for which ones will be affected.
But what if you had a list of hosts that you know you wanted to target like you would if you’re doing a specific deployment task? You’d have had to do something like:
c.identity_filter /^host1|host2|host3|host4$/ |
c.identity_filter /^host1|host2|host3|host4$/
Instead of the fact filter, not ideal! It would still be doing a discover and should host4 not be around it will not really tell you it can’t talk to 4. All it knows is there’s a regex to match.
Now since MCollective 2.0.0 the situation is hugely improved, here’s the client again this time supplying custom discovery data:
c = rpcclient("service")

c.discover :nodes => File.readline("hosts.txt").map {|i| i.chomp}

printrpc c.restart(:service => "httpd")

unless c.stats.noresponsefrom.empty?
   STDERR.puts "WARNING: No responses from hosts: %s" % [c.stats.noresponsefrom.join(", ")]
end |
c = rpcclient("service")
c.discover :nodes => File.readline("hosts.txt").map {|i| i.chomp}
printrpc c.restart(:service => "httpd")
unless c.stats.noresponsefrom.empty?
STDERR.puts "WARNING: No responses from hosts: %s" % [c.stats.noresponsefrom.join(", ")]
end
In this example I am reading a text file called hosts.txt that should have 1 hostname per line and passing that into the discover method. This switches the MCollective client into Direct Addressing mode and it will attempt to communicate with just the hosts you provided in the host list.
Communication is still via the Message Broker even in direct mode but under the covers this is built using queues.
Now if any of those hosts aren’t responding in time you will get an actual useful error message that you could handle in your code in whatever way you wish.
Also note that we were not compelled to construct a filter that would match every host like in the past, just giving the list of identities were enough.
This is a lot more suitable for the purpose of building deployment tools or web applications where you might have arbitrary hosts. This also demonstrates that you are effectively doing discovery against a text file and can easily be adapted to communicate with a database or any data you might have on the client side.
Other Possibilities
This mode opens up a whole bunch of possibilities and I’ll run through a few here – and there will be follow up posts covering some of these in more detail:
Command Chaining
You can now chain RPC requests via Unix pipes:
% mco rpc package status package=foo -j | jgrep data.version=1.2.3 | mco rpc puppetd runonce |
% mco rpc package status package=foo -j | jgrep data.version=1.2.3 | mco rpc puppetd runonce
This fetches the package version of the foo package, filters out only the nodes where the version is 1.2.3 and then does a Puppet run on those nodes. The Puppet run is using the filtered result set from the first command as a source of discovery information so you do not need to supply any filters or anything like that.
Batched Requests
To avoid affecting all discovered nodes at the same time you can now do things in smaller batches, carving up the total discovered nodes into smaller chunks:
% mco rpc service restart service=httpd --batch=2 --batch-sleep=60 |
% mco rpc service restart service=httpd --batch=2 --batch-sleep=60
This will look on the surface the exact same as before, progress bar and all, but it will progress in groups of 2 and sleep a minute between each group. It will still be traditional discovery (Unless you use -I), the results will look the same, everything will be the same except it will just affect 2 machines at a time.
You can ^C at any time to bail out and only the batches up to that point will be affected.
Traffic Optimization
If you have a 1000 nodes and you often just communicate with a small amount – say 10 – the broadcast mode is not very efficient, the middleware will shunt messages to all 1000 all the time.
Since 2.0.0 the client will switch to Direct Addressing mode if it determines you are communicating with No discovery for identity only filters
If you are only using the -I option and not supplying regular expressions MCollective will now switch to direct addressing mode and just assume you know what you’re doing.
% mco rpc rpcutil ping -I devco.net

 * [============================================================> ] 1 / 1

devco.net
   Timestamp: 1340117924

Finished processing 1 / 1 hosts in 62.17 ms |
% mco rpc rpcutil ping -I devco.net
* [============================================================> ] 1 / 1
devco.net
Timestamp: 1340117924
Finished processing 1 / 1 hosts in 62.17 ms
Note there’s no indication that it’s doing any discovery – that’s because it completely bypassed that step, you can specify multiple -I arguments to go out to many machines.
The total runtime here will be very close to 70ms vs the old 2 seconds for discovery and 70ms for the main request.
Pluggable Discovery
Now that we can get host lists from anywhere we’ve made discovery completely pluggable allowing you to decide what is your preferred source of truth that suits your needs best.
Here are some examples:
Query a flatfile:
% mco rpc service restart service=httpd --nodes=hosts.txt |
% mco rpc service restart service=httpd --nodes=hosts.txt
Discover using data kept in PuppetDB:
% mco rpc service restart service=httpd -W country=uk --dm=puppetdb |
% mco rpc service restart service=httpd -W country=uk --dm=puppetdb
There are plugins for flatfiles, PuppetDB, MongoDB as built by registration, old style broadcast mode (the default) and more will be written like a recent one by a community member that queries Elastic Search. Imagine discovering against Zookeeper, Chef Server, Noah or any other data source you can imagine. Direct Addressing makes all of that possible.
This is a MCollective 2.1.x feature only at the moment so still maturing in the development series.
Message TTLs
Directly addressed messages are implemented using queues, this means they can linger on the network when no-one is there to consume them. Using this feature we can send RPC requests to nodes that do not exist yet – time band that request and should the node become active during the TTL they will act on that request:
% mco rpc service restart service=httpd --ttl 1000 -I some.node |
% mco rpc service restart service=httpd --ttl 1000 -I some.node
This request will go sit in the queue for some.node and if that machine boots up in the next 1000 seconds it will perform the request. The TTLs are low by default and it does mean your clocks need to be synced. RPC to non existing hosts though, quite interesting bootstrapping possibilities.
Entirely new styles of application built ontop of MCollective
Now that the MCollective messaging has been abstracted out of core it would be fairly easy to apply MCollective to non request/response style systems. We can use MCollective libraries to just transport arbitrary data between 2 processes. This will be done using the security, serialization and connector plugins meaning that you can write generic code and just reuse my libraries to have pluggable security and network capabilities.
The system now supports sending requests and reading the replies elsewhere. For a web based system this would allow a 100% async model. You could send your request from the web page and have the replies spool into a temporary storage like a NoSQL database where you show the result sets using paging and traditional web approaches. This combined with arbitrary discovery sources means an entirely new kind of web application can be built using MCollective RPC that’s very fast, responsive and feature rich
Conclusion
That’s a quick intro to the new messaging rewrite covering just a few areas it’s already improved. I’ll follow up with more in depth blog posts about some of the items mentioned above.
Having this mode doesn’t deprecate or invalidate the older broadcast mode, I still believe this is the right approach for zero config systems, still believe its method of degrading is the right way to build a certain kind of application and MCollective will remain suitable to those kinds of application. It will remain the default mode for a freshly installed MCollective client. The new mode enhances the existing capabilities.
A side effect of all of this rewriting is that the connectivity plugin is now in full control of how this is implemented paving the way for wider middleware support in the future. At the moment the only viable way to use this feature is to use ActiveMQ but we’ll add more plugins in the future.
Given the above statement Direct Addressing isn’t yet enabled by default but expect that to change in the next major release.
by R.I. Pienaar | Aug 14, 2011 | Uncategorized
A while ago Techcrunch profiled a company called Nodeable who closed 2 mil funding. They bill themselves as a social network for servers and have some cartoon and a beta invite box on their site but no actual usable information. I signed up but never heard from them. So I’ve not seen what they’re doing at all.
Either way I thought the idea sucked.
Since then I kept coming back to it thinking maybe it’s not bad at all, I’ve seen many companies try to include the rest of the business into the status of their networks with big graph boards and complex alerting that is perhaps not suited to the audience.
These experiments often fail and cause more confusion than clarity as the underlying systems are not designed to be friendly to business people. I had a quick twitter convo with @patrickdebois too and a few people on ##infra-talk were keen on the idea. It’s not really a surprise that a lot of us want to make the events stream of our systems more accessible to the business and other interested parties.
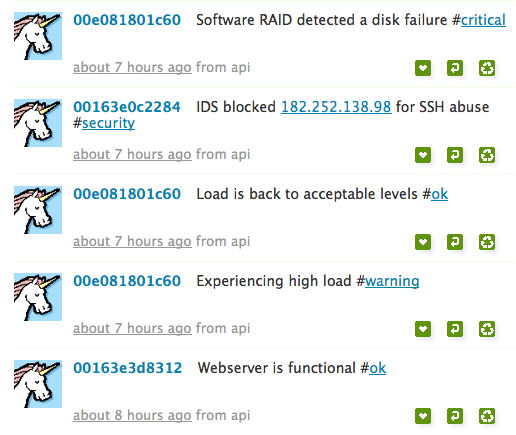
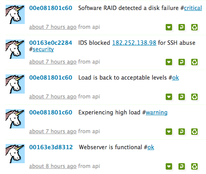 So I setup a copy of status.net – actually I used the excellent appliance from Turnkey Linux and it took 10 minutes. I gave each of my machines an account with the username being their MAC address and hooked into my existing event stream, it was all less than 150 lines of code and the result is quite pleasing.
What makes this compelling is specifically that it is void of technical details, no mention of /dev/sda1 and byte counts and percentages that makes text hard to scan or understand by non tech people. Just simple things like Experiencing high load #warning This is something normal people can easily digest. It’s small enough to scan really quickly and for many users this is all they need to know.
At the moment I have Puppet changes, IDS events and Nagios events showing up on a twitter like timeline for all my machines. I hash tag the tweets using things like #security, #puppet, and #fail for failing puppet resources. #critical, #warning, #ok for nagios etc. I plan on also adding hash tags matching machine roles as captured in my CM. Click on the image to the right for a bigger example.
Status.net is unfortunately not the tool to build this on, it’s simply too buggy and too limited. You can make groups and add machines to groups but this isn’t something like Twitters lists thats user managed, I can see a case where a webmaster will just add the machines he knows his apps runs on in a list and follow that. You can’t easily do this with status.net. My machines has their fqdn as real names, why on earth status.net doesn’t show real names in the timeline I don’t get, I hope it’s a setting I missed. I might look towards something like Yammer for this or if Nodable eventually ships something that might do.
I think the idea has a lot of merit. If I think about the 500 people I follow on twitter, its hard work but not at all unmanageable and you would hope those 500 people are more chatty than a well managed set of servers. The tools we already use like lists, selective following, hashtags and clients for mobiles, desktop, email notifications and RSS all apply to this use case.
Imagine your servers profile information contained a short description of function. The contact email address is the team responsible for it. The geo information is datacenter coordinates. You could identify ‘hot spots’ in your infrastructure by just looking at tweets on a map. Just like we do with tweets for people.
I think the idea has legs, status.net is a disappointment. I am quite keen to see what Nodeable comes out with and I will keep playing with this idea.
by R.I. Pienaar | Jul 3, 2011 | Uncategorized
I’ve wanted to be notified the moment Puppet changes a resource for ages, I’ve often been told this cannot be done without monkey patching nasty Puppet internals.
Those following me on Twitter have no doubt noticed my tweets complaining about the complexities in getting this done. I’ve now managed to get this done so am happy to share here.
 The end result is that my previously mentioned event system is now getting messages sent the moment Puppet does anything. And I have callbacks at the event system layer so I can now instantly react to change anywhere on my network.
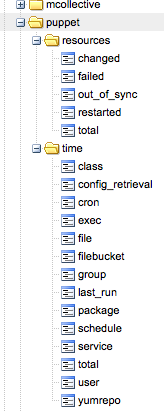
If a new webserver in a certain cluster comes up I can instantly notify the load balancer to add it – perhaps via a Puppet run of of its own. This lets me build reactive cross node orchestration. Apart from the callbacks I also get run metrics in Graphite as seen in the image.
The best way I found to make Puppet do this is by creating your own transaction reports processor that is the client side of a normal puppet report, here’s a shortened version of what I did. It’s overly complex and a pain to get working since Puppet Pluginsync still cannot sync out things like Applications.
The code overrides the finalize_report method to send the final run metrics and the add_resource_status method to publish events for changing resources. Puppet will use the add_resource_status method to add the status of a resource right after evaluating that resource. By tapping into this method we can send events to the network the moment the resource has changed.
require 'puppet/transaction/report'

class Puppet::Transaction::UnimatrixReport < Puppet::Transaction::Report
  def initialize(kind, configuration_version=nil)
    super(kind, configuration_version)

    @um_config = YAML.load_file("/etc/puppet/unimatrix.yaml")
  end

  def um_connection
    @um_connection ||= Stomp::Connection.new(@um_config[:user], @um_config[:password], @um_config[:server], @um_config[:port], true)
  end

  def um_newevent
    event = { ... } # skeleton event, removed for brevity
  end

  def finalize_report
    super

    metrics = um_newevent
    sum = raw_summary

    # add run metrics from raw_summary to metrics, removed for brevity

    Timeout::timeout(2) { um_connection.publish(@um_config[:portal], metrics.to_json) }
  end

  def add_resource_status(status)
    super(status)

    if status.changed?
      event = um_newevent

      # add event status to event hash, removed for brevity

      Timeout::timeout(2) { um_connection.publish(@um_config[:portal], event.to_json) }
    end
  end
end |
require 'puppet/transaction/report'
class Puppet::Transaction::UnimatrixReport < Puppet::Transaction::Report
def initialize(kind, configuration_version=nil)
super(kind, configuration_version)
@um_config = YAML.load_file("/etc/puppet/unimatrix.yaml")
end
def um_connection
@um_connection ||= Stomp::Connection.new(@um_config[:user], @um_config[:password], @um_config[:server], @um_config[:port], true)
end
def um_newevent
event = { ... } # skeleton event, removed for brevity
end
def finalize_report
super
metrics = um_newevent
sum = raw_summary
# add run metrics from raw_summary to metrics, removed for brevity
Timeout::timeout(2) { um_connection.publish(@um_config[:portal], metrics.to_json) }
end
def add_resource_status(status)
super(status)
if status.changed?
event = um_newevent
# add event status to event hash, removed for brevity
Timeout::timeout(2) { um_connection.publish(@um_config[:portal], event.to_json) }
end
end
end
Finally as I really have no need for sending reports to my Puppet Masters I created a small Application that replace the standard agent. This application has access to the report even when reporting is disabled so it will never get saved to disk or copied to the masters.
This application sets up the report using the class above and creates a log destination that feeds the logs into it. This is more or less exactly the Puppet::Application::Agent so I retain all my normal CLI usage like –tags and –test etc.
require 'puppet/application'
require 'puppet/application/agent'
require 'rubygems'
require 'stomp'
require 'json'

class Puppet::Application::Unimatrix < Puppet::Application::Agent
  run_mode :unimatrix

  def onetime
    unless options[:client]
      $stderr.puts "onetime is specified but there is no client"
      exit(43)
      return
    end

    @daemon.set_signal_traps

    begin
      require 'puppet/transaction/unimatrixreport'
      report = Puppet::Transaction::UnimatrixReport.new("unimatrix")

      # Reports get logs, so we need to make a logging destination that understands our report.
      Puppet::Util::Log.newdesttype :unimatrixreport do
        attr_reader :report

        match "Puppet::Transaction::UnimatrixReport"

        def initialize(report)
          @report = report
        end

        def handle(msg)
          @report << msg
        end
      end

      @agent.run(:report => report)
    rescue => detail
      puts detail.backtrace if Puppet[:trace]
      Puppet.err detail.to_s
    end

    if not report
      exit(1)
    elsif options[:detailed_exitcodes] then
      exit(report.exit_status)
    else
      exit(0)
    end
  end
end |
require 'puppet/application'
require 'puppet/application/agent'
require 'rubygems'
require 'stomp'
require 'json'
class Puppet::Application::Unimatrix < Puppet::Application::Agent
run_mode :unimatrix
def onetime
unless options[:client]
$stderr.puts "onetime is specified but there is no client"
exit(43)
return
end
@daemon.set_signal_traps
begin
require 'puppet/transaction/unimatrixreport'
report = Puppet::Transaction::UnimatrixReport.new("unimatrix")
# Reports get logs, so we need to make a logging destination that understands our report.
Puppet::Util::Log.newdesttype :unimatrixreport do
attr_reader :report
match "Puppet::Transaction::UnimatrixReport"
def initialize(report)
@report = report
end
def handle(msg)
@report << msg
end
end
@agent.run(:report => report)
rescue => detail
puts detail.backtrace if Puppet[:trace]
Puppet.err detail.to_s
end
if not report
exit(1)
elsif options[:detailed_exitcodes] then
exit(report.exit_status)
else
exit(0)
end
end
end
And finally I can now create a callback in my event system this example is over simplified but the gist of it is that I am triggering a Puppet run on my machines with class roles::frontend_lb as a result of a web server starting on any machine with the class roles::frontend_web – effectively immediately causing newly created machines to get into the pool. The Puppet run is triggered via MCollective so I am using it’s discovery capabilities to run all the instances of load balancers.
add_callback(:name => "puppet_change", :type => ["archive"]) do |event|
   data = event["extended_data"]

   if data["resource_title"] && data["resource_type"]
      if event["name"] == "Service[httpd]"
         # only when its a new start, this is short for brevity you want to do some more checks
         if data["restarted"] == false && data["tags"].include?("roles::frontend_web")
           # does a puppet run via mcollective on the frontend load balancer
           UM::Util.run_puppet(:class_filter => "roles::frontend_lb")
         end
     end
  end
end |
add_callback(:name => "puppet_change", :type => ["archive"]) do |event|
data = event["extended_data"]
if data["resource_title"] && data["resource_type"]
if event["name"] == "Service[httpd]"
# only when its a new start, this is short for brevity you want to do some more checks
if data["restarted"] == false && data["tags"].include?("roles::frontend_web")
# does a puppet run via mcollective on the frontend load balancer
UM::Util.run_puppet(:class_filter => "roles::frontend_lb")
end
end
end
end
Doing this via a Puppet run demonstrates to me where the balance lie between Orchestration and CM. You still need to be able to build a new machine, and that new machine needs to be in the same state as those that were managed using the Orchestration tool. So by using MCollective to trigger Puppet runs I know I am not doing anything out of bounds of my CM system, I am simply causing it to work when I want it to work.