The Choria Server is the agent component of the Choria Orchestrator system, it runs on every node and maintains a connection to the middleware.
Traditionally we’ve configured it using Puppet along with its mcollective compatibility layer. We intend to keep this model for the foreseeable future. Choria Server though has many more uses – it’s embeddable so can be used in IoT, tools like our go-backplane, side cars in kubernetes in more. In these and other cases the Puppet model do not work:
You do not have CM at all
You do not own the machines where Choria runs on, you provide a orchestration service to other teams
You are embedding the Choria Server in your own code, perhaps in a IoT device where Puppet does not make sense
Your scale makes using Puppet not an option
You wish to have very dynamic decision making about node placement
You wish to integrate Choria into your own Certificate Authority system
In all these cases there are real complex problems to solve in configuring Choria Server. We’ve built a system that can help solve this problem, it’s called the Choria Server Provisioner and this post introduce it.
Server side design
The Provisioner is inspired by old school bootstrap PXE networks – unconfigured nodes would join a VLAN where they will do network boot and get their configuration, once configured they reboot into the right VLAN where they will be production servers.
As in that model Choria has a mode called Provisioning Mode where it will use compiled in defaults for it’s bootstrap configuration – essentially to find its equivalent of a PXE VLAN – and then it will allow programatic configuration.
Here under Server Settings you can see the compiled in defaults. When this server starts up without a configuration that specifically prevent provisioning mode it will connect to prov.example.net:4222 without TLS, in that mode it will only connect to the provisioning sub collective and it will publish periodically its /etc/choria/metadata.json to the topic choria.provisioning_data.
In the next release of Choria the method for discovering the provisioning broker is pluggable, so you can supply any logic you wish rather than use this single compile time flag.
It will have an agent choria_provision running that expose actions to request a CSR, configure it, restart it and more.
It will then wait until some process starts interacting with it and eventually give it a configuration file and ask it to restart. Once restarted it will join it’s real home and continue there as a normal server. This is where the Choria Server Provisioner come in.
Choria Server Provisioner
As you saw above the Choria Server will connect to a specific broker and sit in a provisioning sub collective waiting to be managed. We wrote a generic high performance manager that lets you plug your logic into it and it will configure your nodes. In our tests with a very fast helper script this process is capable of provisioning many thousands of machines a minute – many more than any cloud will allow you to boot.
The basic flow that the provisioner has is this:
On startup it will:
start to listen for events on the topic choria.provisioning_data
do a discover on the provisioning sub collective and keep doing it on regular intervals
Any nodes identified using any of these 2 methods are added to the work queue where one of the configured number of workers will start provisioning them, this per worker flow is:
Fetch the inventory using rpcutil#inventory
Request a CSR if the PKI feature is enabled using choria_provision#gencsr
Call the helper with the inventory and CSR, expecting to be configured
If the helper sets defer to true the node provisioning is ended and next cycle will handle it
Helper returns a configuration, signed certificate and CA chain in JSON format
Configure the node using choria_provision#configure
Restart the node using choria_provision#restart
You can see here this is a generic flow and all the magic is left up to a helper, so lets look at the helper in detail.
The helper is simply a script or program written in any configuration language that receives node specific JSON on STDIN and returns JSON on its STDOUT.
In this example the PKI feature is enabled and the CSR seen here was created by the node in question – and it kept its private key secure there never transferring it anywhere. The inventory is what you would get if you ran mco rpc rpcutil inventory -I node1.example.net, here the main thing you’d look at is the facts which would be all the metadata found in /etc/choria/metadata.json.
The helper then is any program that outputs JSON resembling this:
{
  "defer": false,
  "msg": "Reason why the provisioning is being defered",
  "certificate": "-----BEGIN CERTIFICATE-----......-----END CERTIFICATE-----",
  "ca": "-----BEGIN CERTIFICATE-----......-----END CERTIFICATE-----",
  "configuration": {
    "plugin.choria.server.provision": "false",
    "identity": "node1.example.net"
  }
}
{
"defer": false,
"msg": "Reason why the provisioning is being defered",
"certificate": "-----BEGIN CERTIFICATE-----......-----END CERTIFICATE-----",
"ca": "-----BEGIN CERTIFICATE-----......-----END CERTIFICATE-----",
"configuration": {
"plugin.choria.server.provision": "false",
"identity": "node1.example.net"
}
}
Here’s a bit of code showing CFSSL integration and country specific configuration:
request = JSON.parse(STDIN.read)
request["inventory"] = JSON.parse(request["inventory"])
reply = {"defer"=>false,
"msg"=>"",
"certificate"=>"",
"ca"=>"",
"configuration"=>{}}
identity = request["identity"]if request["csr"]&& request["csr"]["csr"]
ssldir = request["csr"]["ssldir"]# save the CSRFile.open("%s.csr"% identity, "w")do|f|
f.puts request["csr"]["csr"]end# sign the CSR using CFSSL
signed = %x[cfssl sign -ca ca.pem-ca-key ca-key.pem-loglevel 5#{identity}.csr 2>&1]
signed = JSON.parse(signed)
abort("No signed certificate received from cfssl")unless signed["cert"]# Store the CA and the signed cert in the reply
reply["ca"] = File.read("ca.pem")
reply["certificate"] = signed["cert"]# Create security configuration customised to the SSL directory the server chose
reply["configuration"].merge!("plugin.security.provider"=>"file",
"plugin.security.file.certificate"=>File.join(ssldir, "certificate.pem"),
"plugin.security.file.key"=>File.join(ssldir, "private.pem"),
"plugin.security.file.ca"=>File.join(ssldir, "ca.pem"),
"plugin.security.file.cache"=>File.join(ssldir, "cache"))end
request = JSON.parse(STDIN.read)
request["inventory"] = JSON.parse(request["inventory"])

reply = {
  "defer" => false,
  "msg" => "",
  "certificate" => "",
  "ca" => "",
  "configuration" => {}
}

identity = request["identity"]

if request["csr"] && request["csr"]["csr"]
  ssldir = request["csr"]["ssldir"]

  # save the CSR
  File.open("%s.csr" % identity, "w") do |f|
    f.puts request["csr"]["csr"]
  end

  # sign the CSR using CFSSL
  signed = %x[cfssl sign -ca ca.pem -ca-key ca-key.pem -loglevel 5 #{identity}.csr 2>&1]
  signed = JSON.parse(signed)
  abort("No signed certificate received from cfssl") unless signed["cert"]

  # Store the CA and the signed cert in the reply
  reply["ca"] = File.read("ca.pem")
  reply["certificate"] = signed["cert"]

  # Create security configuration customised to the SSL directory the server chose
  reply["configuration"].merge!(
    "plugin.security.provider" => "file",
    "plugin.security.file.certificate" => File.join(ssldir, "certificate.pem"),
    "plugin.security.file.key" => File.join(ssldir, "private.pem"),
    "plugin.security.file.ca" => File.join(ssldir, "ca.pem"),
    "plugin.security.file.cache" => File.join(ssldir, "cache")
  )
end
With that out of the way lets create the rest of our configuration, we’re going to look at per country specific brokers here:
The configuration is simply Choria configuration as key value pairs – all strings. With the provisioning mode on by default you must disable it specifically so be sure to set plugin.choria.server.provision=false.
You can see you can potentially integrate into any CA you wish and employ any logic or data source for making the configuration. In this case we used the CFSSL CLI but you’d in reality use its API and I integrate with our asset databases to ensure a node goes with the rest of it’s POD – we have multiple networks per DC and this helps our orchestrators perform better. You could perhaps consider using Jerakia for a more suitable store for this than the case statement above.
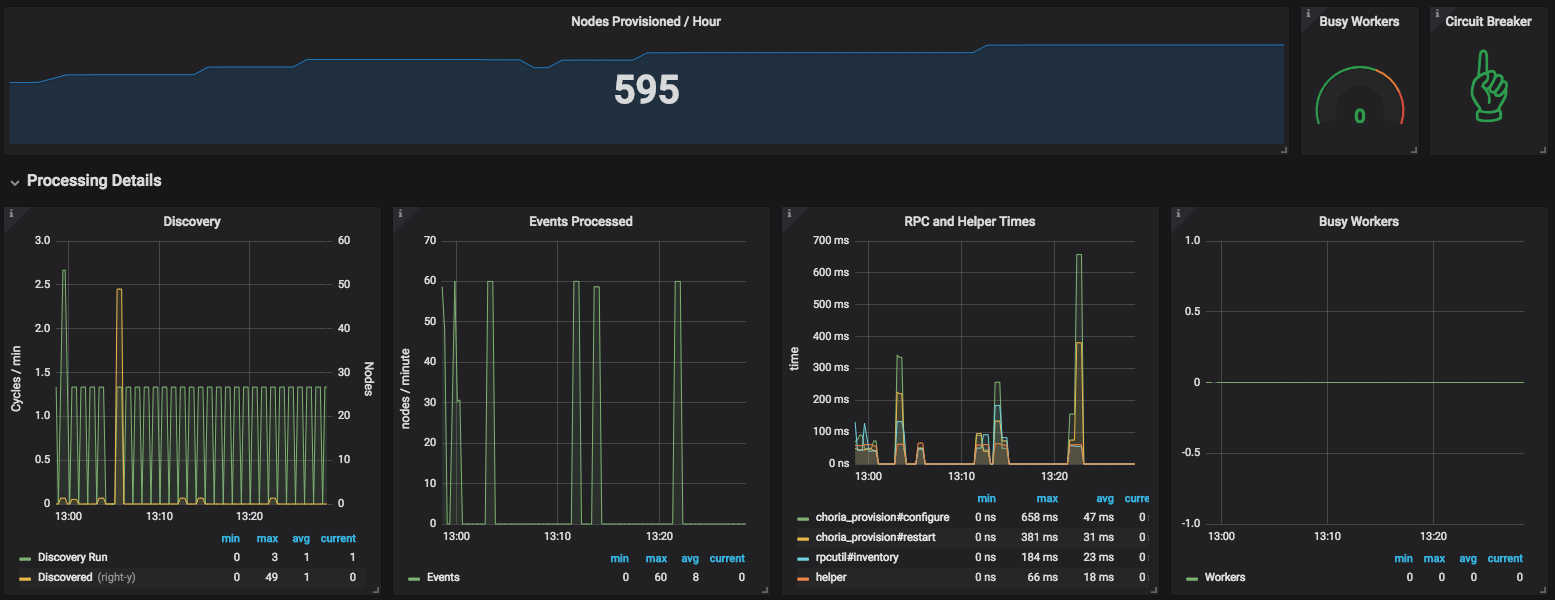
The provisioner will expose it’s statistics using Prometheus format and it embeds our Choria Backplane so you can perform actions like Circuit Breaking etc fleet wide.
This dashboard is available in the GitHub repository.
Demonstration
I made a video explainer that goes in more detail and show the system in action:
Conclusion
This is a quick introduction to the process, there’s a lot more to know – you can write your own custom provisioner and even your own custom agent and more – the provisioning-agent GitHub repository has all the details. The provisioner detailed above is released as RPMs on our package cloud repo.
It’s a bit early days for this tool – personally I will soon roll it out to 10s of data centres where it will manages 100s of thousands of nodes, expect a few more hardening changes to be made. In the future we’ll also support Choria version upgrades as part of this cycle.
It’s been a while since my previous update and quite a bit have happened since.
Choria Server
As previously mentioned the Choria Server will aim to replace mcollectived eventually. Thus far I was focussed on it’s registration subsystem, Golang based MCollective RPC compatible agents and being able to embed it into other software for IoT and management backplanes.
Over the last few weeks I learned that MCollective will no longer be shipped in Puppet Agent version 6 which is currently due around Fall 2018. This means we have to accelerate making Choria standalone in it’s own right.
A number of things have to happen to get there:
Choria Server should support Ruby agents
The Ruby libraries Choria Server needs either need to be embedded and placed dynamically or provided via a Gem
The Ruby client needs to be provided via a Gem
New locations for these Ruby parts are needed outside of AIO Ruby
Yesterday I released the first step in this direction, you can now replace mcollectived with choria server. For now I am marking this as a preview/beta feature while we deal with issues the community finds.
The way this works is that we provide a small shim that uses just enough of MCollective to get the RPC framework running – luckily this was initially developed as a MCollective plugin and it retained its quite separate code base. When the Go code needs to invoke a ruby agent it will call the shim to do so, the shim in turn will provide the result from the agent – in JSON format – back to Go.
This works for me with any agent I’ve tried it with and I am quite pleased with the results:
USER       PID %CPU %MEM    VSZ   RSS TTY      STAT START   TIME COMMAND
root     10820  0.0  1.1 1306584 47436 ?       Sl   13:50   0:06 /opt/puppetlabs/puppet/bin/ruby /opt/puppetlabs/puppet/bin/mcollectived
USER PID %CPU %MEM VSZ RSS TTY STAT START TIME COMMAND
root 10820 0.0 1.1 1306584 47436 ? Sl 13:50 0:06 /opt/puppetlabs/puppet/bin/ruby /opt/puppetlabs/puppet/bin/mcollectived
MCollective would of course include the entire Puppet as soon as any agent that uses Puppet is loaded – service, package, puppet – and so over time things only get worse. Here is Choria:
USER       PID %CPU %MEM    VSZ   RSS TTY      STAT START   TIME COMMAND
root     32396  0.0  0.5 296436  9732 ?        Ssl  16:07   0:03 /usr/sbin/choria server --config=/etc/choria/server.conf
USER PID %CPU %MEM VSZ RSS TTY STAT START TIME COMMAND
root 32396 0.0 0.5 296436 9732 ? Ssl 16:07 0:03 /usr/sbin/choria server --config=/etc/choria/server.conf
I run a couple 100 000 instances of this and this is what you get, it never changes really. This is because Choria spawns the Ruby code and that will exit when done.
This has an unfortunate side effect that the service, package and puppet agents are around 1 second slower per invocation because loading Puppet is really slow. Ones that do not load Puppet are only marginally slower.
Some of the reasons for breakage that you might run into – like mco facts is not working now with Choria Server – is due to a hugely significant change in the background. Choria – both plugged into MCollective and Standalone – is JSON safe. The Ruby Plugin is optionally so (and off by default) but the Choria daemon only supports JSON.
Traditionally MCollective have used YAML on the wire, being quite old JSON was really not that big a deal back in the early 2000s when the foundation for this choice was laid down, XML was more important. Worse MCollective have exposed Ruby specific data types and YAML extensions on the wire which have made creating cross platform support nearly impossible.
YAML is also of course capable of carrying any object – which means some agents are just never going to be compatible with anything but Ruby. This was the case with the process agent but I fixed that before shipping it in Choria. It also essentially means YAML can invoke things you might not have anticipated and so happens big security problems.
Since quite some time now the Choria protocol is defined, versioned and JSON schemas are available. The protocol makes the separation between Payload, Security, Transport and Federation much clearer and the protocol can now support anything that can move JSON – Middleware, REST, SSH, Postal Doves are all capable of carrying Choria packets.
There is a separate Golang implementation of the protocol that is transport agnostic and the schemas are there. Version 1 of the protocol is a tad skewed to MCollective but Version 2 (not yet planned) will drop those shackles. A single Choria Server is capable of serving multiple versions of the network protocol and communicate with old and new clients.
Golang being a static language and having a really solid and completely compatible implementation of the protocol means making ones for other languages like Python etc will not be hard. However I think long term the better option for other languages are still a capable REST gateway.
I did some POC work on a very very light weight protocol suitable for devices like Arduino and will provide bridging between the worlds in our Federation Brokers. You’ll be able to mco rpc wallplug off, your client will talk full Choria Protocol and the wall plug might speak a super light weight MQTT based protocol and you will not even know this.
There are some gotchas as a result of these changes, also captured in the Choria Server evaluation documentation. To resolve some of these I need to be much more aggressive with what I do to the MCollective libraries, something I can do once they are liberated out of Puppet Agent.
Extending Puppet using types, providers, facts and functions are well known and widely done. Something new is how to add entire new data types to the Puppet DSL to create entirely new language behaviours.
I’ve done a bunch of this recently with the Choria Playbooks and some other fun experiments, today I’ll walk through building a small network wide spec system using the Puppet DSL.
Overview
A quick look at what we want to achieve here, I want to be able to do Choria RPC requests and assert their outcomes, I want to write tests using the Puppet DSL and they should run on a specially prepared environment. In my case I have a AWS environment with CentOS, Ubuntu, Debian and Archlinux machines:
So we want to make a Spec like system that can drive Puppet Plans (aka Choria Playbooks) and do various assertions on the outcome.
We want to run it with mco playbook run and it should write a JSON report to disk with all suites, cases and assertions.
Adding a new Data Type to Puppet
I’ll show how to add the Cspec::Suite data Type to Puppet. This comes in 2 parts: You have to describe the Type that is exposed to Puppet and you have to provide a Ruby implementation of the Type.
As you can see from the line of code cspec::suite(“filemgr agent tests”, $fail_fast, $report) |$suite| {….} we pass 3 arguments: a description of the test, if the test should fail immediately on any error or keep going and there to write the report of the suite to. This corresponds to the attributes here. A function that will be shown later takes these and make our instance.
We then have to add our it() function which again takes a description and yields out `Cspec::Case`, it returns any value.
When Puppet needs the implementation of this code it will call the Ruby class PuppetX::Cspec::Suite.
The implementation is a Ruby class that provide the logic we want, I won’t show the entire thing with reporting and everything but you’ll get the basic idea:
# modules/cspec/lib/puppet_x/cspec/suite.rbmodule PuppetX
class Cspec
class Suite
# Puppet calls this method when it needs an instance of this typedefself.from_asserted_hash(description, fail_fast, report)
new(description, fail_fast, report)end
attr_reader :description, :fail_fastdef initialize(description, fail_fast, report)@description = description
@fail_fast = !!fail_fast
@report = report
@testcases = []end# what puppet file and line the Puppet DSL is ondef puppet_file_line
fl = Puppet::Pops::PuppetStack.stacktrace[0][fl[0], fl[1]]enddef outcome
{"testsuite"=>@description,
"testcases"=>@testcases,
"file"=> puppet_file_line[0],
"line"=> puppet_file_line[1],
"success"=>@testcases.all?{|t| t["success"]}}end# Writes the memory state to disk, see outcome abovedef write_report
# ...enddef run_suite
Puppet.notice(">>>")
Puppet.notice(">>> Starting test suite: %s"%[@description])
Puppet.notice(">>>")beginyield(self)ensure
write_report
end
Puppet.notice(">>>")
Puppet.notice(">>> Completed test suite: %s"%[@description])
Puppet.notice(">>>")enddef it(description, &blk)
require_relative "case"
t = PuppetX::Cspec::Case.new(self, description)
t.run(&blk)ensure@testcases<< t.outcomeendendendend
# modules/cspec/lib/puppet_x/cspec/suite.rb
module PuppetX
  class Cspec
    class Suite
      # Puppet calls this method when it needs an instance of this type
      def self.from_asserted_hash(description, fail_fast, report)
        new(description, fail_fast, report)
      end

      attr_reader :description, :fail_fast

      def initialize(description, fail_fast, report)
        @description = description
        @fail_fast = !!fail_fast
        @report = report
        @testcases = []
      end

      # what puppet file and line the Puppet DSL is on
      def puppet_file_line
        fl = Puppet::Pops::PuppetStack.stacktrace[0]

        [fl[0], fl[1]]
      end

      def outcome
        {
          "testsuite" => @description,
          "testcases" => @testcases,
          "file" => puppet_file_line[0],
          "line" => puppet_file_line[1],
          "success" => @testcases.all?{|t| t["success"]}
        }
      end

      # Writes the memory state to disk, see outcome above
      def write_report
        # ...
      end

      def run_suite
        Puppet.notice(">>>")
        Puppet.notice(">>> Starting test suite: %s" % [@description])
        Puppet.notice(">>>")

        begin
          yield(self)
        ensure
          write_report
        end


        Puppet.notice(">>>")
        Puppet.notice(">>> Completed test suite: %s" % [@description])
        Puppet.notice(">>>")
      end

      def it(description, &blk)
        require_relative "case"

        t = PuppetX::Cspec::Case.new(self, description)
        t.run(&blk)
      ensure
        @testcases << t.outcome
      end
    end
  end
end
And here is the Cspec::Case:
# modules/cspec/lib/puppet_x/cspec/case.rbmodule PuppetX
class Cspec
classCase# Puppet calls this to make instancesdefself.from_asserted_hash(suite, description)
new(suite, description)enddef initialize(suite, description)@suite = suite
@description = description
@assertions = []@start_location = puppet_file_line
end# assert 2 things are equal and show sender etc in the outputdef assert_task_data_equals(result, left, right)if left == right
success("assert_task_data_equals", "%s success"% result.host)returntrueend
failure("assert_task_data_equals: %s"% result.host, "%s\n\n\tis not equal to\n\n %s"%[left, right])end# checks the outcome of a choria RPC request and make sure its finedef assert_task_success(results)if results.error_set.empty?
success("assert_task_success:", "%d OK results"% results.count)returntrueend
failure("assert_task_success:", "%d failures"%[results.error_set.count])end# assert 2 things are equaldef assert_equal(left, right)if left == right
success("assert_equal", "values matches")returntrueend
failure("assert_equal", "%s\n\n\tis not equal to\n\n %s"%[left, right])end# the puppet .pp file and line Puppet is ondef puppet_file_line
fl = Puppet::Pops::PuppetStack.stacktrace[0][fl[0], fl[1]]end# show a OK message, store the assertions that randef success(what, message)@assertions<<{"success"=>true,
"kind"=> what,
"file"=> puppet_file_line[0],
"line"=> puppet_file_line[1],
"message"=> message
}
Puppet.notice("✔︎ %s: %s"%[what, message])end# show a Error message, store the assertions that randef failure(what, message)@assertions<<{"success"=>false,
"kind"=> what,
"file"=> puppet_file_line[0],
"line"=> puppet_file_line[1],
"message"=> message
}
Puppet.err("✘ %s: %s"%[what, @description])
Puppet.err(message)raise(Puppet::Error, "Test case %s fast failed: %s"%[@description, what])if@suite.fail_fastend# this will show up in the report JSONdef outcome
{"testcase"=>@description,
"assertions"=>@assertions,
"success"=>@assertions.all? {|a| a["success"]},
"file"=>@start_location[0],
"line"=>@start_location[1]}end# invokes the test casedef run
Puppet.notice("==== Test case: %s"%[@description])# runs the puppet blockyield(self)
success("testcase", @description)endendendend
# modules/cspec/lib/puppet_x/cspec/case.rb
module PuppetX
class Cspec
class Case
# Puppet calls this to make instances
def self.from_asserted_hash(suite, description)
new(suite, description)
end
def initialize(suite, description)
@suite = suite
@description = description
@assertions = []
@start_location = puppet_file_line
end
# assert 2 things are equal and show sender etc in the output
def assert_task_data_equals(result, left, right)
if left == right
success("assert_task_data_equals", "%s success" % result.host)
return true
end
failure("assert_task_data_equals: %s" % result.host, "%s\n\n\tis not equal to\n\n %s" % [left, right])
end
# checks the outcome of a choria RPC request and make sure its fine
def assert_task_success(results)
if results.error_set.empty?
success("assert_task_success:", "%d OK results" % results.count)
return true
end
failure("assert_task_success:", "%d failures" % [results.error_set.count])
end
# assert 2 things are equal
def assert_equal(left, right)
if left == right
success("assert_equal", "values matches")
return true
end
failure("assert_equal", "%s\n\n\tis not equal to\n\n %s" % [left, right])
end
# the puppet .pp file and line Puppet is on
def puppet_file_line
fl = Puppet::Pops::PuppetStack.stacktrace[0]
[fl[0], fl[1]]
end
# show a OK message, store the assertions that ran
def success(what, message)
@assertions << {
"success" => true,
"kind" => what,
"file" => puppet_file_line[0],
"line" => puppet_file_line[1],
"message" => message
}
Puppet.notice("✔︎ %s: %s" % [what, message])
end
# show a Error message, store the assertions that ran
def failure(what, message)
@assertions << {
"success" => false,
"kind" => what,
"file" => puppet_file_line[0],
"line" => puppet_file_line[1],
"message" => message
}
Puppet.err("✘ %s: %s" % [what, @description])
Puppet.err(message)
raise(Puppet::Error, "Test case %s fast failed: %s" % [@description, what]) if @suite.fail_fast
end
# this will show up in the report JSON
def outcome
{
"testcase" => @description,
"assertions" => @assertions,
"success" => @assertions.all? {|a| a["success"]},
"file" => @start_location[0],
"line" => @start_location[1]
}
end
# invokes the test case
def run
Puppet.notice("==== Test case: %s" % [@description])
# runs the puppet block
yield(self)
success("testcase", @description)
end
end
end
end
Finally I am going to need a little function to create the suite – cspec::suite function, it really just creates an instance of PuppetX::Cspec::Suite for us.
# modules/cspec/lib/puppet/functions/cspec/suite.rb
Puppet::Functions.create_function(:"cspec::suite") do
  dispatch :handler do
    param "String", :description
    param "Boolean", :fail_fast
    param "String", :report

    block_param

    return_type "Cspec::Suite"
  end

  def handler(description, fail_fast, report, &blk)
    suite = PuppetX::Cspec::Suite.new(description, fail_fast, report)

    suite.run_suite(&blk)
    suite
  end
end
Bringing it together
So that’s about it, it’s very simple really the code above is pretty basic stuff to achieve all of this, I hacked it together in a day basically.
Lets see how we turn these building blocks into a test suite.
I need a entry point that drives the suite – imagine I will have many different plans to run, one per agent and that I want to do some pre and post run tasks etc.
plan cspec::suite (
  Boolean $fail_fast = false,
  Boolean $pre_post = true,
  Stdlib::Absolutepath $report,
  String $data
) {
  $ds = {
    "type"   => "file",
    "file"   => $data,
    "format" => "yaml"
  }

  # initializes the report
  cspec::clear_report($report)

  # force a puppet run everywhere so PuppetDB is up to date, disables Puppet, wait for them to finish
  if $pre_post {
    choria::run_playbook("cspec::pre_flight", ds => $ds)
  }

  # Run our test suite
  choria::run_playbook("cspec::run_suites", _catch_errors => true,
    ds => $ds,
    fail_fast => $fail_fast,
    report => $report
  )
    .choria::on_error |$err| {
      err("Test suite failed with a critical error: ${err.message}")
    }

  # enables Puppet
  if $pre_post {
    choria::run_playbook("cspec::post_flight", ds => $ds)
  }

  # reads the report from disk and creates a basic overview structure
  cspec::summarize_report($report)
}
plan cspec::suite (
Boolean $fail_fast = false,
Boolean $pre_post = true,
Stdlib::Absolutepath $report,
String $data
) {
$ds = {
"type" => "file",
"file" => $data,
"format" => "yaml"
}
# initializes the report
cspec::clear_report($report)
# force a puppet run everywhere so PuppetDB is up to date, disables Puppet, wait for them to finish
if $pre_post {
choria::run_playbook("cspec::pre_flight", ds => $ds)
}
# Run our test suite
choria::run_playbook("cspec::run_suites", _catch_errors => true,
ds => $ds,
fail_fast => $fail_fast,
report => $report
)
.choria::on_error |$err| {
err("Test suite failed with a critical error: ${err.message}")
}
# enables Puppet
if $pre_post {
choria::run_playbook("cspec::post_flight", ds => $ds)
}
# reads the report from disk and creates a basic overview structure
cspec::summarize_report($report)
}
Here’s the cspec::run_suites Playbook that takes data from a Choria data source and drives the suite dynamically:
And finally a YAML file defining the suite, this file describes my AWS environment that I use to do integration tests for Choria and you can see there’s a bunch of other tests here in the suites list and some of them will take data like what nodes to expect etc.
So this then is a rather quick walk through of extending Puppet in ways many of us would not have seen before. I spent about a day getting this all working which included figuring out a way to maintain the mutating report state internally etc, the outcome is a test suite I can run and it will thoroughly drive a working 5 node network and assert the outcomes against real machines running real software.
I used to have a MCollective integration test suite, but I think this is a LOT nicer mainly due to the Choria Playbooks and extensibility of modern Puppet.
$ mco playbook run cspec::suite --data `pwd`/suite.yaml --report `pwd`/report.json
$ mco playbook run cspec::suite --data `pwd`/suite.yaml --report `pwd`/report.json
The current code for this is on GitHub along with some Terraform code to stand up a test environment, it’s a bit barren right now but I’ll add details in the next few weeks.
I’ve been saying for a while now my aim with Choria is that someone can get a 50 000 node Choria network that just works without tuning, like, by default that should be the scale it supports at minimum.
I started working on a set of emulators to let you confirm that yourself – and for me to use it during development to ensure I do not break this promise – though that got a bit side tracked as I wanted to do less emulation and more just running 50 000 instances of actual Choria, more on that in a future post.
Today I want to talk a bit about a actual 50 000 real nodes deployment and how I got there – the good news is that it’s terribly boring since as promised it just works.
Setup
Network
The network is pretty much just your typical DC network. Bunch of TOR switches, Distribution switches and Core switches, nothing special. Many dom0’s and many more domUs and some specialised machines. It’s flat there are firewalls between all things but it’s all in one building.
Hardware
I have 4 machines, 3 set aside for the Choria Network Broker Cluster and 1 for a client, while waiting for my firewall ports I just used the 1 machine for all the nodes as well as the client. It’s a 8GB RAM VM with 4 vCPU, not overly fancy at all. Runs Enterprise Linux 6.
In the past I think we’d have considered this machine on the small side for a ActiveMQ network with 1000 nodes 😛
I’ll show some details of the single Choria Network Broker here and later follow up about the clustered setup.
Just to be clear, I am going to show managing 50 000 nodes on a machine that’s the equivalent of a $40/month Linode.
Choria
I run a custom build of Choria 0.0.11, I bump the max connections up to 100k and turned off SSL since we simply can’t provision certificates, so a custom build let me get around all that.
The real reason for the custom build though is that we compile in our agent into the binary so the whole deployment that goes out to all nodes and broker is basically what you see below, no further dependencies at all, this makes for quite a nice deployment story since we’re a bit challenged in that regard.
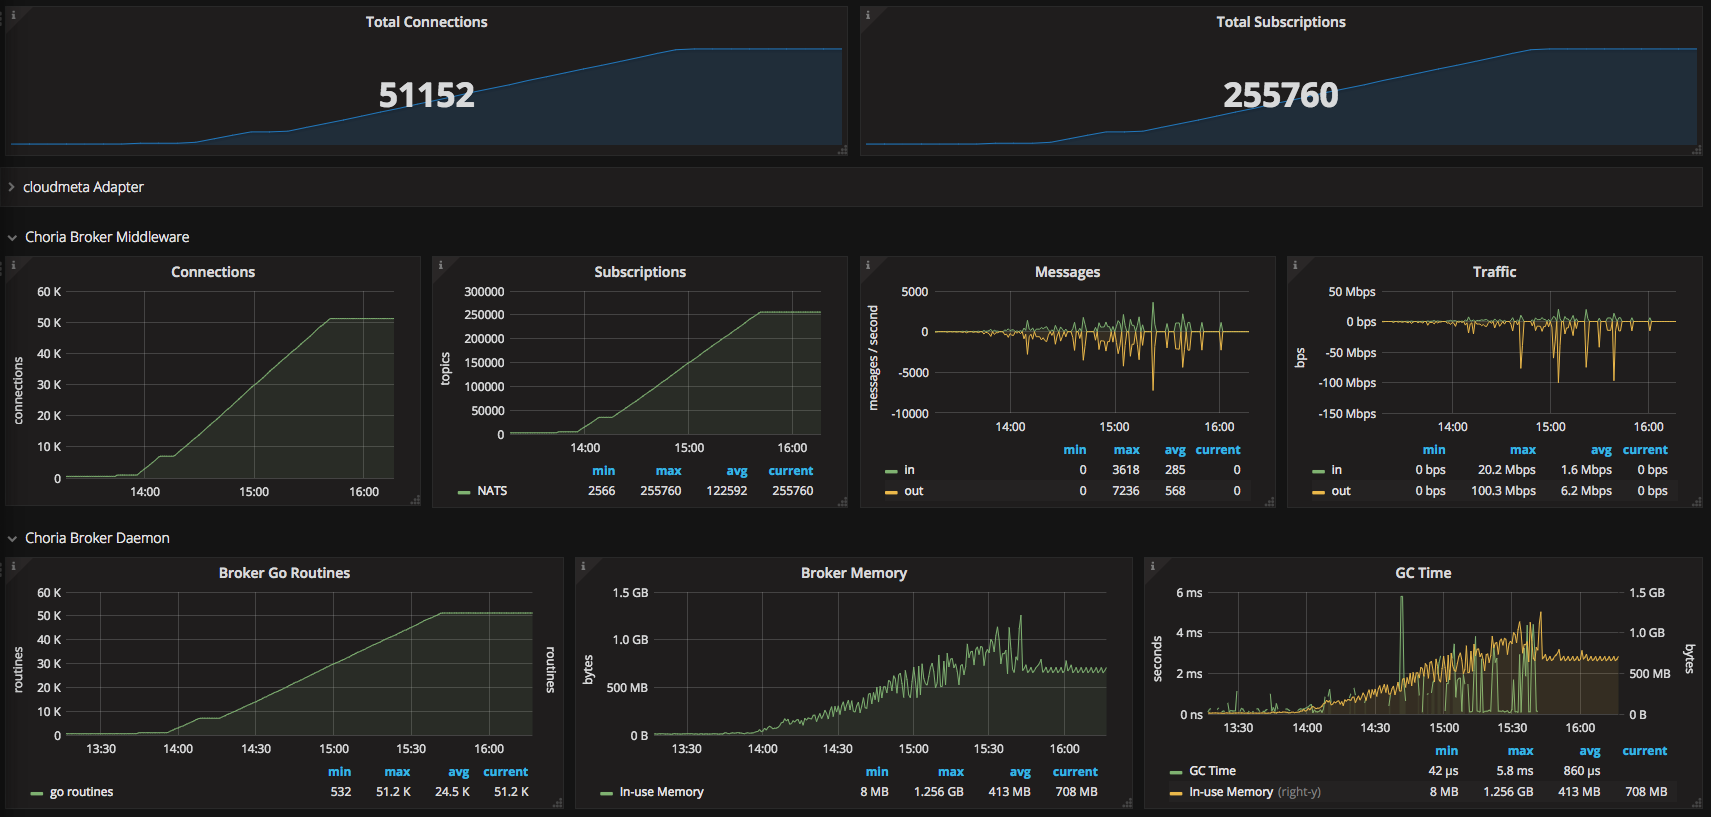
So we were being quite conservative and deployed it in batches of 50 a time, you can see the graph below of this process as seen from the Choria Network Broker (click for larger):
This is all pretty boring actually, quite predictable growth in memory, go routines, cpu etc. The messages you see being sent is me doing lots of pings and rpc’s and stuff just to check it’s all going well.
# a bit later than the image above
$ sudo netstat -anp|grep 22365|grep ESTAB|wc -l
58319
# a bit later than the image above
$ sudo netstat -anp|grep 22365|grep ESTAB|wc -l
58319
Outcome
So how does work in practise? In the past we’d have had a lot of issues with getting consistency out of a network of even 10% this size, I was quite confident it was not the Ruby side, but you never know?
Well, lets look at this one, I set discovery_timeout = 20 in my client configuration:
$ mco rpc rpcutil ping --display failed
$ mco rpc rpcutil ping --display failed
Finished processing 51152 / 51152 hosts in 20675.80 ms
Finished processing 51152 / 51152 hosts in 20746.82 ms
Finished processing 51152 / 51152 hosts in 20778.17 ms
Finished processing 51152 / 51152 hosts in 22627.80 ms
Finished processing 51152 / 51152 hosts in 20238.92 ms
Finished processing 51152 / 51152 hosts in 20675.80 ms
Finished processing 51152 / 51152 hosts in 20746.82 ms
Finished processing 51152 / 51152 hosts in 20778.17 ms
Finished processing 51152 / 51152 hosts in 22627.80 ms
Finished processing 51152 / 51152 hosts in 20238.92 ms
That’s a huge huge improvement, and this is without fancy discovery methods or databases or anything – it’s the, generally fairly unreliable, broadcast based method of discovery. These same nodes on a big RabbitMQ cluster never gets a consistent result (and it’s 40 seconds slower), so this is a huge win for me.
I am still using the Ruby code here of course and it’s single threaded and stuck on 1 CPU, so in practise it’s going to have a hard ceiling of churning through about 2500 to 3000 replies/second, hence the long timeouts there.
I have a go based ping, it round trips this network in less than 3.5 seconds quite reliably – wow.
The broker peaked at 25Mbps at times when doing many concurrent RPC requests and pings etc, but it’s all just been pretty good with no surprises.
The ruby client is a bit big so as a final test I bumped the RAM on this node to 16GB. If I run 6 x RPC clients at exactly the same time doing a full estate RPC round trip (including broadcast based discovery) all 6 clients get exactly the same results consistently. So I guess I know the Ruby code was never the problem and I am very glad to see code I designed and wrote in 2009 scaling to this size – the Ruby client code really have never been touched after initial development.
So, that’s about it, I really can’t complain about this.
It’s been a while since I posted about Choria and where things are. There are major changes in the pipeline so it’s well overdue a update.
The features mentioned here will become current in the next release cycle – about 2 weeks from now.
New choria module
The current gen Choria modules grew a bit organically and there’s a bit of a confusion between the various modules. I now have a new choria module, it will consume features from the current modules and deprecate them.
On the next release it can manage:
Choria YUM and APT repos
Choria Package
Choria Network Broker
Choria Federation Broker
Choria Data Adatpaters
Network Brokers
We have had amazing success with the NATS broker, lightweight, fast, stable. It’s perfect for Choria. While I had a pretty good module to configure it I wanted to create a more singular experience. Towards that there is a new Choria Broker incoming that manages an embedded NATS instance.
To show what I am on about, imagine this is all that is required to configure a cluster of 3 production ready brokers capable of hosting 50k or more Choria managed nodes on modestly specced machines:
Of course there is Puppet code to do this for you in choria::broker.
That’s it, start the choria-broker daemon and you’re done – and ready to monitor it using Prometheus. Like before it’s all TLS and all that kinds of good stuff.
Federation Brokers
We had good success with the Ruby Federation Brokers but they also had issues particularly around deployment as we had to deploy many instances of them and they tended to be quite big Ruby processes.
The same choria-broker that hosts the Network Broker will now also host a new Golang based Federation Broker network. Configuration is about the same as before you don’t need to learn new things, you just have to move to the configuration in choria::broker and retire the old ones.
Unlike the past where you had to run 2 or 3 of the Federation Brokers per node you now do not run any additional processes, you just enable the feature in the singular choria-broker, you only get 1 process. Internally each run 10 instances of the Federation Broker, its much more performant and scalable.
Monitoring is done via Prometheus.
Data Adapters
Previously we had all kinds of fairly bad schemes to manage registration in MCollective. The MCollective daemon would make requests to a registration agent, you’d designate one or more nodes as running this agent and so build either a file store, mongodb store etc.
This was fine at small size but soon enough the concurrency in large networks would overwhelm what could realistically be expected from the Agent mechanism to manage.
I’ve often wanted to revisit that but did not know what approach to take. In the years since then the Stream Processing world has exploded with tools like Kafka, NATS Streaming and offerings from GPC, AWS and Azure etc.
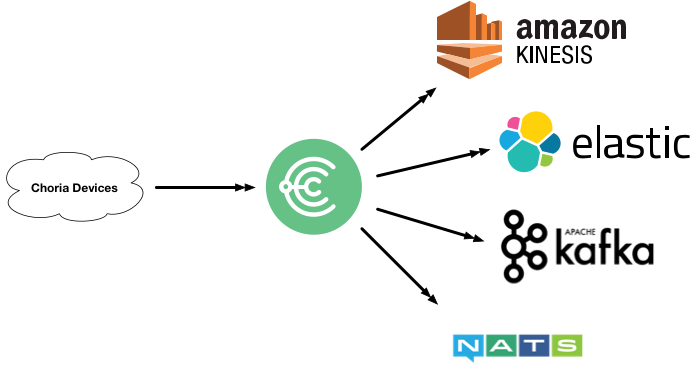
Data Adapters are hosted in the Choria Broker and provide stateless, horizontally and vertically scalable Adapters that can take data from Choria and translate and publish them into other systems.
Today I support NATS Streaming and the code is at first-iteration quality, problems I hope to solve with this:
Very large global scale node metadata ingest
IoT data ingest – the upcoming Choria Server is embeddable into any Go project and it can exfil data into Stream Processors using this framework
Asynchronous RPC – replies to requests streaming into Kafka for later processing, more suitable for web apps etc
Adhoc asynchronous data rewrites – we have had feature requests where person one can make a request but not see replies, they go into Elastic Search
Plugins
After 18 months of trying to get Puppet Inc to let me continue development on the old code base I have finally given up. The plugins are now hosted in their own GitHub Organisation.
I’ve released a number of plugins that were never released under Choria.
I’ve updated all their docs to be Choria specific rather than out dated install docs.
I’ve added Action Policy rules allowing read only actions by default – eg. puppet status will work for anyone, puppet runonce will give access denied.
I’ve started adding Playbooks the first ones are mcollective_agent_puppet::enable, mcollective_agent_puppet::disable and mcollective_agent_puppet::disable_and_wait.
Embeddable Choria
The new Choria Server is embeddable into any Go project. This is not a new area of research for me – this was actually the problem I tried to solve when I first wrote the current gen MCollective, but i never got so far really.
The idea is that if you have some application – like my Prometheus Streams system – where you will run many of a specific daemon each with different properties and areas of responsibility you can make that daemon connect to a Choria network as if it’s a normal Choria Server. The purpose of that is to embed into the daemon it’s life cycle management and provide an external API into this.
The above mentioned Prometheus Streams server for example have a circuit breaker that can start/stop the polling and replication of data:
$ mco rpc prometheus_streams switch -T prometheus
Discovering hosts using the mc method for 2 second(s) .... 1

 * [ ============================================================> ] 1 / 1


prom.example.net
     Mode: poller
   Paused: true


Summary of Mode:

   poller = 1

Summary of Paused:

   false = 1

Finished processing 1 / 1 hosts in 399.81 ms
$ mco rpc prometheus_streams switch -T prometheus
Discovering hosts using the mc method for 2 second(s) .... 1
* [ ============================================================> ] 1 / 1
prom.example.net
Mode: poller
Paused: true
Summary of Mode:
poller = 1
Summary of Paused:
false = 1
Finished processing 1 / 1 hosts in 399.81 ms
Here I am communicating with the internals of the Go process, they sit in their of Sub Collective, expose facts and RPC endpoints. I can use discovery to find all only nodes in certain modes, with certain jobs etc and perform functions you’d typically do via a REST management interface over a more suitable interface.
Likewise I’ve embedded a Choria Server into IoT systems where it uses the above mentioned Data Adapters to publish temperature and humidity while giving me the ability to extract from those devices data in demand using RPC and do things like in-place upgrades of the running binary on my IoT network.
You can use this today in your own projects and it’s compatible with the Ruby Choria you already run. A full walk through of doing this can be found in the ripienaar/embedded-choria-sample repository.