I’ve been saying for a while now my aim with Choria is that someone can get a 50 000 node Choria network that just works without tuning, like, by default that should be the scale it supports at minimum.
I started working on a set of emulators to let you confirm that yourself – and for me to use it during development to ensure I do not break this promise – though that got a bit side tracked as I wanted to do less emulation and more just running 50 000 instances of actual Choria, more on that in a future post.
Today I want to talk a bit about a actual 50 000 real nodes deployment and how I got there – the good news is that it’s terribly boring since as promised it just works.
Setup
Network
The network is pretty much just your typical DC network. Bunch of TOR switches, Distribution switches and Core switches, nothing special. Many dom0’s and many more domUs and some specialised machines. It’s flat there are firewalls between all things but it’s all in one building.
Hardware
I have 4 machines, 3 set aside for the Choria Network Broker Cluster and 1 for a client, while waiting for my firewall ports I just used the 1 machine for all the nodes as well as the client. It’s a 8GB RAM VM with 4 vCPU, not overly fancy at all. Runs Enterprise Linux 6.
In the past I think we’d have considered this machine on the small side for a ActiveMQ network with 1000 nodes 😛
I’ll show some details of the single Choria Network Broker here and later follow up about the clustered setup.
Just to be clear, I am going to show managing 50 000 nodes on a machine that’s the equivalent of a $40/month Linode.
Choria
I run a custom build of Choria 0.0.11, I bump the max connections up to 100k and turned off SSL since we simply can’t provision certificates, so a custom build let me get around all that.
The real reason for the custom build though is that we compile in our agent into the binary so the whole deployment that goes out to all nodes and broker is basically what you see below, no further dependencies at all, this makes for quite a nice deployment story since we’re a bit challenged in that regard.
$ rpm -ql choria /etc/choria/broker.conf /etc/choria/server.conf /etc/logrotate.d/choria /etc/init.d/choria-broker /etc/init.d/choria-server /etc/sysconfig/choria-broker /etc/sysconfig/choria-server /usr/sbin/choria |
Other than this custom agent and no SSL we’re about on par what you’d get if you just install Choria from the repos.
Network Broker Setup
The Choria Network Broker is deployed basically exactly as the docs. Including setting the sysctl values to what was specified in the docs.
identity = choria1.example.net logfile = /var/log/choria.log plugin.choria.stats_address = :: plugin.choria.stats_port = 8222 plugin.choria.network.listen_address = :: plugin.choria.network.client_port = 4222 plugin.choria.network.peer_port = 4223 |
Most of this isn’t even needed basically if you use defaults like you should.
Server Setup
The server setup was even more boring:
logger_type = file logfile = /var/log/choria.log plugin.choria.middleware_hosts = choria1.example.net plugin.choria.use_srv = false |
Deployment
So we were being quite conservative and deployed it in batches of 50 a time, you can see the graph below of this process as seen from the Choria Network Broker (click for larger):
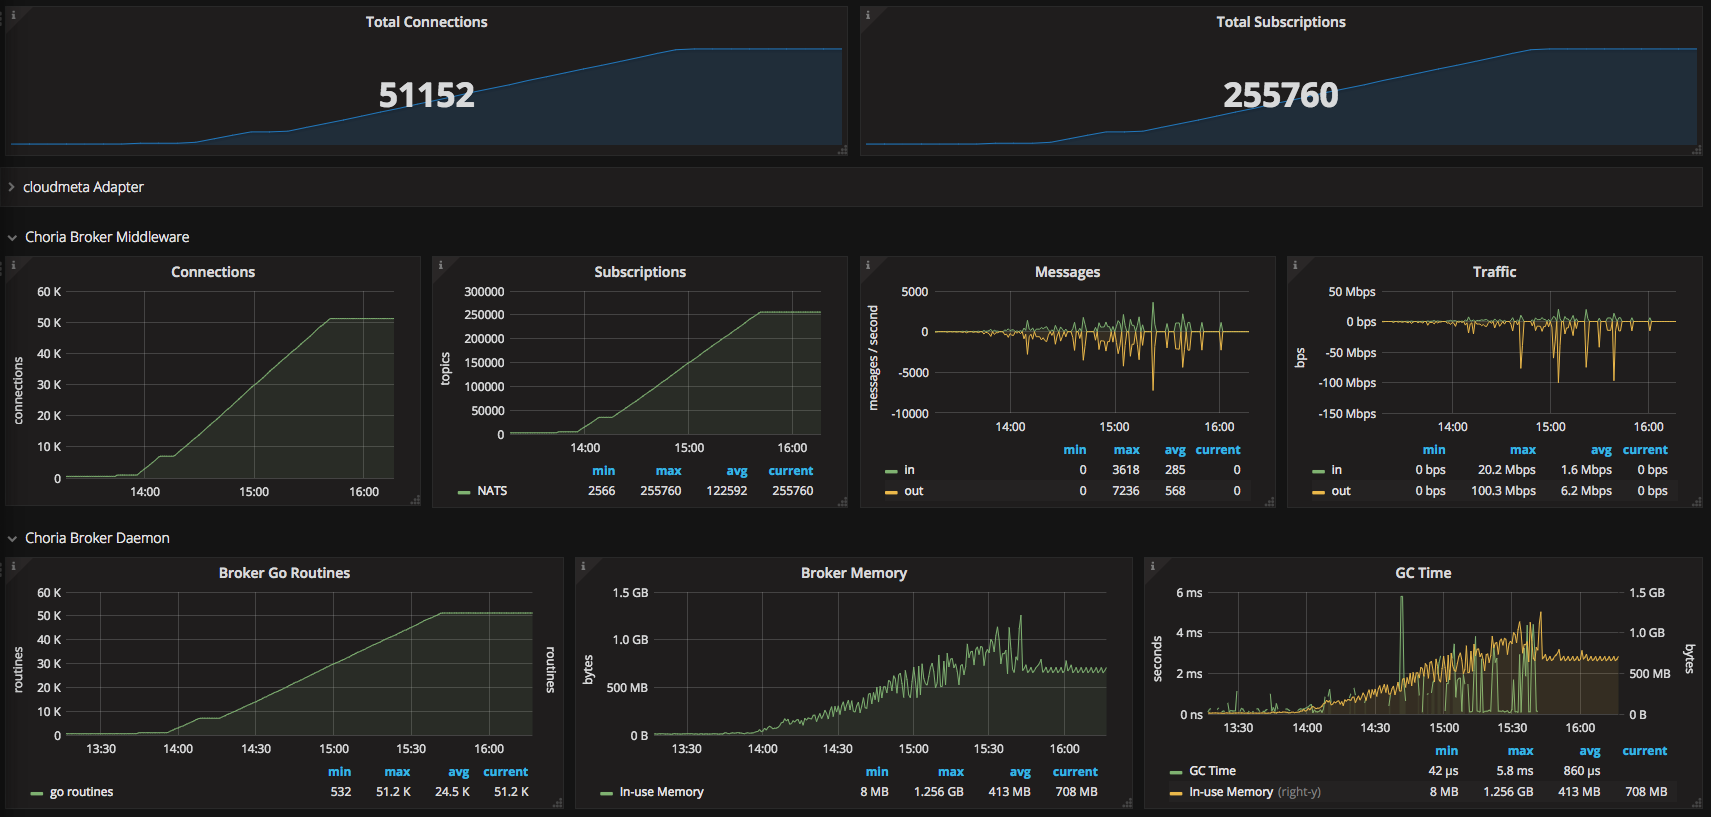
This is all pretty boring actually, quite predictable growth in memory, go routines, cpu etc. The messages you see being sent is me doing lots of pings and rpc’s and stuff just to check it’s all going well.
$ ps -auxw|grep choria root 22365 12.9 14.4 2879712 1175928 ? Sl Mar06 241:34 /usr/choria broker --config=.... |
# a bit later than the image above $ sudo netstat -anp|grep 22365|grep ESTAB|wc -l 58319 |
Outcome
So how does work in practise? In the past we’d have had a lot of issues with getting consistency out of a network of even 10% this size, I was quite confident it was not the Ruby side, but you never know?
Well, lets look at this one, I set discovery_timeout = 20 in my client configuration:
$ mco rpc rpcutil ping --display failed |
Finished processing 51152 / 51152 hosts in 20675.80 ms Finished processing 51152 / 51152 hosts in 20746.82 ms Finished processing 51152 / 51152 hosts in 20778.17 ms Finished processing 51152 / 51152 hosts in 22627.80 ms Finished processing 51152 / 51152 hosts in 20238.92 ms |
That’s a huge huge improvement, and this is without fancy discovery methods or databases or anything – it’s the, generally fairly unreliable, broadcast based method of discovery. These same nodes on a big RabbitMQ cluster never gets a consistent result (and it’s 40 seconds slower), so this is a huge win for me.
I am still using the Ruby code here of course and it’s single threaded and stuck on 1 CPU, so in practise it’s going to have a hard ceiling of churning through about 2500 to 3000 replies/second, hence the long timeouts there.
I have a go based ping, it round trips this network in less than 3.5 seconds quite reliably – wow.
The broker peaked at 25Mbps at times when doing many concurrent RPC requests and pings etc, but it’s all just been pretty good with no surprises.
The ruby client is a bit big so as a final test I bumped the RAM on this node to 16GB. If I run 6 x RPC clients at exactly the same time doing a full estate RPC round trip (including broadcast based discovery) all 6 clients get exactly the same results consistently. So I guess I know the Ruby code was never the problem and I am very glad to see code I designed and wrote in 2009 scaling to this size – the Ruby client code really have never been touched after initial development.
So, that’s about it, I really can’t complain about this.
