I’ve blogged a lot about a new kind of monitoring but what I didn’t point out is that I do actually like the existing toolset.
I quite like Nagios. It’s configuration is horrible yes, the web ui is near useless, it throws away useful information like perfdata. It is though a good poller, it’s solid, never crashes, doesn’t use too much resources and have created a fairly decent plugin protocol (except for it’s perfdata representation).
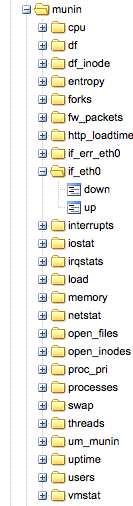 I am at two minds about munin, I like munin-node and the plugin model. I love that there are 100s of plugins available already. I love the introspection that let’s machines discover their own capabilities. But I hate everything about the central munin poller that’s supposed to be able to scale and query all your servers and pre-create graphs. It simply doesn’t work, even on a few 100 machines it’s a completely broken model.
So I am trying to find ways to keep these older tools – and their collective thousands of plugins – around but improve things to bring them into the fold of my ideas about monitoring.
For munin I want to get rid of the central poller, I’d rather have each node produce its data and push it somewhere. In my case I want to put the data into a middleware queue and process the data later into an archive or graphite or some other system like OpenTSDB. I had a look around for some Ruby / Munin integrations and came across a few, I only investigated 2.
Adam Jacob has a nice little munin 2 graphite script that simply talks straight to graphite, this might be enough for some of you so check it out. I also found munin-ruby from Dan Sosedoff which is what I ended up using.
Using the munin-ruby code is really simple:
#!/usr/bin/ruby require 'rubygems' require 'munin-ruby' # connect to munin on localhost munin = Munin::Node.new("localhost", :port => 4949) # get each service and print it's metrics munin.services.each do |service| puts "Metrics for service: #{service}" munin.service(service).params.each_pair do |k, v| puts " #{k} => #{v}" end puts end |
This creates output like this:
Metrics for service: entropy entropy => 174 Metrics for service: forks forks => 7114853 |
So from here it’s not far to go to get these events onto my middleware, I turn them into JSON blobs like, the last one is a stat about the collector:
{"name":"munin","text":"entropy","subject":"devco.net","tags":{},"metrics":{"entropy.entropy":"162"},"origin":"munin","type":"metric","event_time":1317548538,"severity":0} {"name":"munin","text":"forks","subject":"devco.net","tags":{},"metrics":{"forks.forks":"7115300"},"origin":"munin","type":"metric","event_time":1317548538,"severity":0} {"name":"munin","text":"","subject":"devco.net","tags":{},"metrics":{"um_munin.time":3.722587,"um_munin.services":27,"um_munin.metrics":109,"um_munin.sleep":4},"origin":"munin","type":"metric","event_time":1317548538,"severity":0} |
The code that creates and sends this JSON can be seen here, it’s probably useful just to learn from and create your own as that’s a bit specific to me.
Of course my event system already has the infrastructure to turn these JSON events into graphite data that you can see in the image attached to this post so this was a really quick win.
The remaining question is about presentation, I want to create some kind of quick node view system like Munin has. I loved the introspection that you can do to a munin node to discover graph properties there might be something there I can use otherwise I’ll end up making a simple viewer for this.
I imagine for each branch of the munin data like cpu I can either by default just show all the data or take hints from a small DSL no how to present the data there. You’d need to know that some data needs to be derived or used as guages etc. More on that when I had some time to play.
