Apache has its native mod_status status page that many people use to pull stats into tools such as Cacti and other RRDTool based stats packages. This works well but does not always provide enough details, questions such as these remain unanswered:
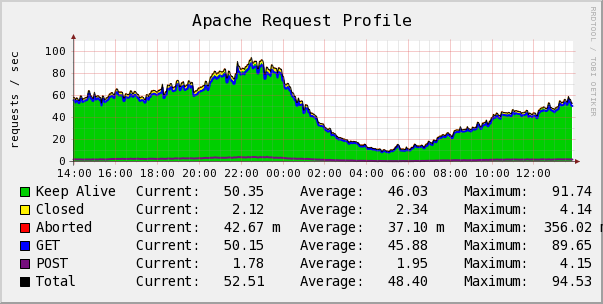
- How many of my requests are GET and how many are POST?
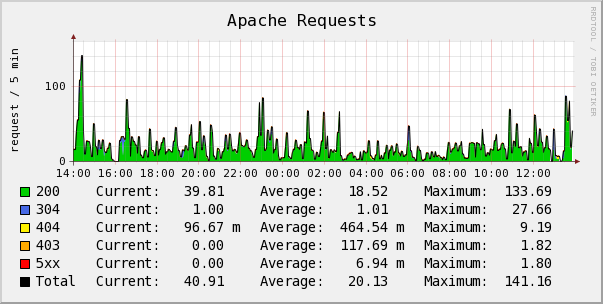
- How many 404 errors and 5xx errors do I get on my site as a whole and for script.php specifically?
- What is the average response time for the whole server, and for script.php?
- How many Closed, Keep Alive and Aborted connections do I have?
To answer this I wrote a script that keeps a running track of your Apache process, it has many fine grained controls that let you fine tune exactly what to keep stats on. I got the initial idea from an old ONLamp article titled Profiling LAMP Applications with Apache’s Blackbox Logs.
The article proposes a custom log format that provides the equivelant to an airplanes blackbox, a flight recorder that records more detail per request than the usual common log formats do. I suggest you read the article for background information. The article though stops short of a full data parser so I wrote one for a client who kindly agreed that I can opensource it.
Using this and some glue in my Cacti I now have graphs showing a profile of the requests I receive for the whole site, but as you are able to apply fine grained controls to select what exactly you’ll see, you could get per server overview stats and details for just a specific scripts performance and statuses:
The script creates on a regular interval a file that contains the performance data, the data is presented in variable=value data pairs, I will soon provide a Cacti and Nagios plugin to parse this output to ease integration into these tools.
The performance data includes values such as:
- Amount of requests in total
- Total size of requests separated by in and out bytes
- Average response time
- Total processing time.
- Counts of connections in Close, Keep Alive and Aborted states.
- Counts for each valid HTTP Status code, and aggregates for 1xx, 2xx, 3xx, 4xx and 5xx.
- The amount of GET and POST requests.
- And detail for each and every unique request the server serves.
See the Sample Stats for a good example, variables are pretty self explanatory. To keep the data set small and manageable 2 selectors exist, one to choose which requests to keep details for and which to keep stats for. These can be combined with standard Apache directives such as Location to provide very fine grained stats for all or a subset of your site.
You would need some glue to plug this into Cacti and Nagios, I will provide a script for this soon as I have time to write up some docs for it.
Install guide etc can be found on my GitHub there is also extensive Perldoc Docs in the script, the GitHub also have links to downloading the script.
